Note: Descriptions are shown in the official language in which they were submitted.
CA 03093818 2020-09-11
WO 2019/178189
PCT/US2019/021991
Improved Methods and Systems for Photo-activated Hydrogen Generation
CROSS-REFERENCE TO RELATED APPLICATIONS
This application claims the benefit of and priority to U.S. Provisional
Application No. 62/642,401 filed
March 13, 2018, the entire disclosure of which is incorporated herein by
reference.
FIELD
The present disclosure relates in general to systems and methods for providing
alternative fuel, in
particular hydrogen photocatalytically generated by a system comprising
photoactive nanoparticles
and a nitrogenase cofactor.
BACKGROUND
The worldwide demand for hydrogen as a green energy carrier source grows
larger with each
passing year. Major auto manufacturers have developed affordable car models
run by hydrogen fuel
cells such as the Toyota Mirai and the Honda Clarity (1,2). Several U.S.
states have adopted
hydrogen highway initiatives with California leading the way (3). Numerous
countries in the EU and
elsewhere have banned sales of internal combustion engines in the next 10 to
15 years (4).
Sustainable hydrogen generating systems that are on-site at point of use are
attractive economically
and environmentally as alternative methods to the most predominant hydrogen
producing method
of steam methane reforming (5). Thus, a need exists for improved systems and
methods for
producing hydrogen.
SUMMARY
In one aspect, provided herein is a system for photocatalytically producing
hydrogen gas, comprising
a water soluble cadmium selenide nanoparticle (CdSe) surface capped with
mercaptosuccinate
(CdSe-MSA) and a NafY=FeMo-co complex comprising a NafY protein and an iron-
molybdenum
cofactor (FeMo-co), wherein the CdSe-MSA and NafY=FeMo-co complex are present
in about 1:2 to
1:10 molar ratio.
In some embodiments, the CdSe-MSA and the NafY=FeMo-co complex can be present
in about 1:2,
1:3, 1:4 or 1:5 molar ratio.
In some embodiments, the system can further include sodium dithionite for
providing protons and
electrons. In some embodiments, the dithionite salt is provided at a
concentration of about 2 mM to 1
M, or about 2-100 mM, or about 2-10 mM. In certain embodiments, the system can
further include
an additional proton source such as ascorbic acid, acetic acid, citric acid,
and carbon dioxide.
1
CA 03093818 2020-09-11
WO 2019/178189
PCT/US2019/021991
In some embodiments, the system is capable of photocatalytically producing
hydrogen gas for an
extended period of about 5-90 days, 10-72 days or 39-72 days.
In various embodiments, the system is kept under anaerobic conditions. The
NafY protein can be
derived from Azotobacter vinelandii. The FeMo-co can be derived from a
molybdenum-iron (MoFe)
protein. The MoFe protein can be derived from Azotobacter vinelandii.
In another aspect, provided herein is a method for producing hydrogen gas,
comprising illuminating
the system disclosed herein with a light source having a peak wavelength of
about 400-525 nm. In
some embodiments, the peak wavelength is about 425 nm. In some embodiments,
the peak
wavelength is about 460 nm. In some embodiments, the light source has an
intensity of about
18,000 to 1,200,000 lux, or about 50,000 to 800,000 lux.
In a further aspect, provided herein is a method for producing hydrogen gas,
comprising illuminating
a system with a light source having a peak wavelength of about 400-525 nm,
wherein the system
comprises a water soluble cadmium selenide nanoparticle (CdSe) surface capped
with
mercaptosuccinate (CdSe-MSA) and a NafY=FeMo-co complex comprising a NafY
protein and an
iron-molybdenum cofactor (FeMo-co).
In some embodiments, the peak wavelength is about 425 nm or about 460 nm. In
some
embodiments, the light source has an intensity of about 18,000 to 1,200,000
lux, or about 50,000 to
800,000 lux.
In some embodiments, the CdSe-MSA and NafY=FeMo-co complex are present in
about 1:1 or lower
molar ratio, e.g., ranging from about 1:2 to about 1:10. In some embodiments,
the CdSe-MSA and
the NafY=FeMo-co complex are present in about 1:2, 1:3, 1:4 or 1:5 molar
ratio.
In some embodiments, the system further comprises sodium dithionite for
providing protons and
electrons. In some embodiments, the dithionite salt is provided at a
concentration of about 2 mM to 1
M, or about 2-100 mM, or about 2-10 mM. In certain embodiments, the system
further comprises an
additional proton source such as ascorbic acid, acetic acid, citric acid, and
carbon dioxide.
In various embodiments, the system is capable of photocatalytically producing
hydrogen gas for an
extended period of about 5-90 days, 10-72 days or 39-72 days.
BRIEF DESCRIPTION OF THE DRAWINGS
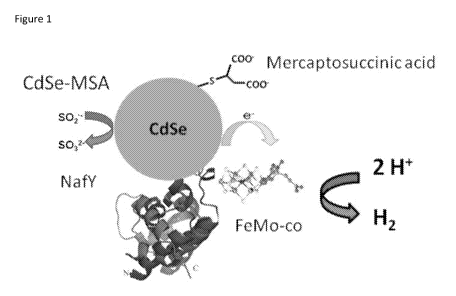
Figure 1. Graphic showing the components of the exemplary hydrogen generation
samples. CdSe (2
uM) capped with mercaptosuccinic acid complexed with NafY-FeMo-co (2 uM).
Sacrificial electron
2
CA 03093818 2020-09-11
WO 2019/178189
PCT/US2019/021991
donor (Na2S204) is present at 2 mM concentration.
Figure 2. Hydrogen generation progress showing exemplary hydrogen samples with
volume of
hydrogen produced comparison over an 18-month period.
Figure 3. Burst rate measured at 24 hours demonstrating the 3000 fold increase
since early
validation experiments. Progress is tracking towards attaining commercial
viability and entry into
the hydrogen and fuel cell markets.
Figure 4. Comparison of hydrogen production in samples illuminated with
specific wavelength LED
light. The samples in front of royal blue LED lights produce the most hydrogen
over time. Reaction
conditions were 2 u.M CdSe, 2 u.M NafY-FeMo-co, 2 mM Na2S204.
Figure 5A. UV-vs spectra of hydrogen generation samples in front of white
lights in a 15-day
experiment. Reaction conditions were 2 u.M CdSe, 2 u.M NafY-FeMo-co, 2 mM
Na2S204. Note the
red shift of the dominant feature of the absorption spectrum measured after 24
hours of light
exposure. This shift correlates with increased rates of hydrogen production.
The absorbance starts
to diminish after 15 days of light exposure, which corresponds with observed
photo-bleaching of the
solution color and a loss of catalytic ability.
Figure 5B. Samples were illuminated with royal blue LEDs with the same
reaction conditions as in
Figure 5A only illuminated with less energetic lights. Note the same initial
red shift of the dominant
feature, but the absorbance diminishes at a quicker rate than those samples
illuminated with white
LEDs. Samples start the degradation and/or photo-bleaching at Day 6
corresponding with
precipitate accumulation.
Figure 6. Plot shows comparison between two sample sets with the same
conditions (2 u.M CdSe,
2u.M NafY-FeMo-co, 2 mM Na2S204), illuminated both with white LEDs, however
with different
intensity measurements. Higher intensity results in higher hydrogen production
rates.
Figure 7. Comparison of two sample sets in front of different intensities but
with the same
wavelength LED light ¨ blue. Reaction conditions are otherwise the same. The
higher intensity LED
illumination results in higher initial hydrogen production.
Figure 8A. Optimization Set Analytics 1 samples were set up in the highest
intensity Royal Blue LED
lights. Samples achieved a high burst rate of roughly 20.5 kg H2/mol
catalyst/day measured at 24
hours of light exposure; however, the catalyst nanoparticle absorbance was not
sustained and the
nanoparticles precipitated within the first 24 hours. Reaction conditions were
2 u.M CdSe, 2u.M
3
CA 03093818 2020-09-11
WO 2019/178189
PCT/US2019/021991
NafY-FeMo-co, 10 mM Na2S204. Note the ratio between the CdSe and NafY-FeMo-co
is 1:1.
Figure 88. Samples set up in front of royal blue LEDS; however, at half the
intensity and with a 1:2
ratio between CdSe and NafY-FeMo-co components. The samples were sustained as
observed by
the UV-vis spectra until significant loss of absorption occurs beyond Day 4 of
light exposure.
Figure 8C. Samples set up in front of royal blue LEDS; however, at half the
intensity and with a 1:3
ratio between CdSe and NafY-FeMo-co components. The samples were sustained as
observed by
the UV-vis spectra until significant absorption loss occurs beyond Day 10 of
light exposure.
Figure 9A and 98. Hydrogen generation for sample sets with 1:2 and 1:3 ratios,
CdSe to NafY-FeMo-
co. 1:2 ratio samples had higher burst rate; however, sustained and steady
hydrogen generation
was demonstrated by the 1:3 ratio samples.
Figures 10A, 1013, and 10C. Contrast of UV-vis data with various ratio between
components in front
of high intensity white LED lights, CdSe to NafY-FeMo-co. The 1:1 ratio UV-vis
absorbance shows
significant diminishing by Day 8. 1:2 samples show absorbance diminishing by
Day 20 with nearly no
absorbance by Day 37. 1:5 samples showed minor loss of absorption of the
spectroscopic features
through Day 25. Sample sets shown in Figure 10A and 1013 were 2 u.M CdSe, 2
u.M NafY-FeMo-co, 5
mM NaCI, 1 mM Na2S204, 2 mM acetic acid. Sample set shown in Figure 10C was a
1:5 ratio with1
u.M CdSe, 5 u.M NafY-FeMo-co, 5 mM NaCI, 1 mM Na2S204, 2 mM acetic acid.
Figure 11A. Total amount of hydrogen produced is shown for the three sets with
different ratios as
described in Figures 10A, 1013, and 10C.
Figure 118. Extrapolated rate shown with steady rates achieved with the 1:2
ratio set. The 1:5 ratio
set achieves a higher rate initial rate than the 1:2 ratio set and also
resulted in a steady state rate
corresponding to the UV-vis absorbance holding steady for multiple weeks.
Figures 12A-12D show four contrasting ratio data sample sets between CdSe and
NafY-FeMo-co at
1:1, 1:2, 1:3 and 1:4 in front of cyan LED lights at high intensity. The
higher ratio samples have the
best sustained absorbance data for the longest period of time. 2 u.M CdSe, 2
u.M NafY-FeMo-co, 5
mM NaCI, 2 mM Na2S204 were the reaction conditions.
Figure 13A. Comparison of total hydrogen produce between the samples in
Figures 12A-12D. The
1:1 have the highest burst rate, however the steady hydrogen production is
demonstrated best with
the 1:2 and 1:3 samples.
Figure 1313. Extrapolated rates show the sustained rates are best achieved
with the higher ratio
4
CA 03093818 2020-09-11
WO 2019/178189
PCT/US2019/021991
sample sets. Higher hydrogen production rates have been achieved with higher
sacrificial donor
loading.
Figure 14. Two sample sets were illuminated with high intensity blue LED
lights. The ratios were 1:1
and 1:4 respectively, CdSe to NafY-FeMo-co. In the harsh blue light
conditions, the 1:4 sample set
maintains homogeneity for 22 days with moderate absorption loss. The 1:1 ratio
sample set
precipitated within 24 hours of light exposure. 2 u.M CdSe, 2 u.M NafY-FeMo-
co, 5 mM NaCI, 10 mM
Na2S204 were the reaction conditions.
Figures 15A and 1513. The hydrogen generation results show a high burst rate
for the 1:1 sample set.
The 1:4 show a sustained steady rate.
Figure 16A. Duration sample sets in the early optimization phase demonstrated
sustained hydrogen
production for 39 days.
Figure 1613. Continuous hydrogen generation in both sample sets in front of
white LED lights and
blue LED lights for 30 days.
Figure 17A. Sample set in front of broad-spectrum halogen light demonstrating
ability of system to
be switched "on" and "off." Sample conditions were 2 u.M CdSe, 2 u.M NafY-FeMo-
co, 2 mM
Na2S204. The first plot shows hydrogen produced in samples vs days since setup
where these
samples were put in front of the light and then removed to the dark for the
time period shown.
Yellow bars indicate days when the samples were provided with light. The
second plot shows
hydrogen produced in the samples vs days of light exposure.
Figure 1713. A sample set labeled "dark," with same reaction conditions were
set up first in dark
conditions and then exposed to light at different intervals from the samples
showing in Figure 17A.
Figures 18A and 1813. Sample set up with these conditions, 2 u.M CdSe, 2 u.M
NafY-FeMo-co, 2 mM
Na2S204. The samples that spent some time in the dark before light exposure
had a small increase in
hydrogen production.
Figures 19A and 1913. Continuation plot of hydrogen generated by LED sample
set shown in 1 Figures
8A and 188. After 12 continuous days of light since set up, the samples were
placed in darkness for
53 days then returned to light for further hydrogen generation. Figure 19A
plots total hydrogen vs
days since setup and Figure 198 plots total hydrogen vs days of light.
Figures 20A and 2013. Further analysis of data from Figures 19A, 198 with the
sample set that
underwent 53 days of darkness. The sample set did continue to produce hydrogen
after resuming
5
CA 03093818 2020-09-11
WO 2019/178189
PCT/US2019/021991
light exposure, but the rate was diminished vs the starting production rate of
the same samples.
Sample conditions were 2 u.M CdSe, 2 u.M NafY-FeMo-co, 2 mM Na2S204. Figure
20A plots total
hydrogen vs days of light where the samples returned to light after 53 days of
darkness were
relabeled with a prime (') and Day 54 is plotted as a new Day 1 of light.
Figure 2013 plots the
extrapolated rate of hydrogen generation vs days of light.
Figures 21A, 216 and 21C. Contrasting UV-vis data from sample sets that were
in front of royal blue
LED lights. In front of the high energy and high intensity light, the samples
shown in Figure 21A show
diminished absorbance by Day 9. Figure 216 show the spectra of the samples
kept in the dark for
the full duration. On Day 12, the dark samples were put in the light and
labeled as Day0' as an
analogous setup time stamp. Figure 21C shows that the spectra for the samples
which started with
12 days of darkness then given light exposure maintained absorbance for 9 days
in the light.
Figures 22A and 226. Hydrogen generation for the samples shown in Figures 21A,
216, and 21C.
Incubation in the dark may have contributed to maintaining spectral integrity;
however, these
samples produced less hydrogen overall. Figure 22A is a plot of total hydrogen
produced vs days of
light, and Figure 226 is extrapolated rate of hydrogen generation vs days of
light.
Figures 23A and 236. More data for from hydrogen producing from sample sets
given a break from
light exposure, ceasing hydrogen production. These samples were in front of
cyan lights. Figure 23A
plots total hydrogen produced vs days since setup with days of darkness
included; whereas, Figure
236 plots total hydrogen produced vs days of light exposure.
Figures 24A and 246. Data demonstrating that spending three days in darkness
in the middle of a 10
day hydrogen generation experiment does not impede hydrogen generation. Figure
24A plots total
hydrogen produced vs days since setup with days of darkness included; whereas,
Figure 246 plots
total hydrogen produced vs days of light exposure.
Figures 25A, 256, and 25C. Sample set with 1:3 ratio between CdSe and NafY-
FeMo-co in front of
high energy blue LED lights. Figure 25A plots total hydrogen produced vs days
since setup with days
of darkness included; whereas, Figure 256 plots total hydrogen produced vs
days of light exposure.
Figure 25C plots extrapolated rate of hydrogen generation vs days of light
exposure.
Figure 26. Hydrogen production for various sample sets with sodium dithionite
alone and additional
sets with sodium dithionite plus ascorbic acid and sodium dithionite plus
acetic acid. All samples
were in front of high intensity blue lights.
Figure 27. Hydrogen production in two sample sets with less intense blue light
and low amounts of
6
CA 03093818 2020-09-11
WO 2019/178189
PCT/US2019/021991
sodium dithionite and sodium dithionite/acetic acid loading. A sustained rate
of hydrogen
production was observed. Reaction conditions 2 u.M CdSe, 2 u.M NafY-FeMo-co,
and 0.5 mM
Na2S204 in one set and 2 u.M CdSe, 2 u.M NafY-FeMo-co, 0.5 mM Na2S204, and 0.5
mM acetic acid in
the other.
DETAILED DESCRIPTION
Unless otherwise defined, all technical and scientific terms used herein have
the same meaning as
commonly understood by one of ordinary skill in the art to which this
disclosure belongs. Methods
and materials are described herein for use in the present disclosure; other,
suitable methods and
materials known in the art can also be used. The materials, methods, and
examples are illustrative
only and not intended to be limiting. All publications, patent applications,
patents, database entries,
and other references mentioned herein are incorporated by reference in their
entirety. In case of
conflict, the present specification, including definitions, will control.
As used herein, the articles "a" and "an" are used herein to refer to one or
to more than one (i.e., to
at least one) of the grammatical object of the article. By way of example, "an
element" means one
element or more than one element.
As used herein, the term "about" means within 20%, more preferably within 10%
and most
preferably within 5%.
"Peak wavelength" means the wavelength at which the optical power of a source
is at maximum.
The present disclosure relates to a catalytic system that can harness solar
energy and produce an
alternative fuel will be the paramount challenge of this new century. Indeed
by its end the most
widely used fossil fuel, petroleum, may have run dry. Several catalytic
systems have been reported
in scientific literature that utilizes both natural products and man-made
components. Some of the
hybrid systems use hydrogenase, an enzyme that both reduces and oxidizes
hydrogen in bacteria,
either alone or in combination with photosystem I, coupled to platinum. The
goal of the present
disclosure was to develop a system that would use a smaller catalytic natural
component along with
a less expensive light harvesting semi-conductor rather than the metal
platinum, which is of limited
availability. Surprisingly, the system of the present disclosure displays
unexpected longevity and can
produce hydrogen for a prolonged period of time. Methods for making and using
the system are
also provided.
Photo-biocatalytic systems that generate renewable hydrogen sources are
appealing for multiple
reasons including because rather than using fossil fuels they tap into visible
light sources to provide
7
CA 03093818 2020-09-11
WO 2019/178189
PCT/US2019/021991
electrons and utilize inexpensive weak acids for feedstocks (7). Recent
advances and improvements
in the CdSe-NafY-FeMo-co catalytic system have achieved various advantages
including, but not
limited to, an on-site at point of use hydrogen delivery system with distinct
commercial advantages.
In embodiments, these improvements have increased hydrogen production rate,
hydrogen
production duration and contributed to better understanding of the catalyst in
order to improve its
performance. Additionally, the increase in hydrogen production rates are
identified as "burst" rates
that are typically observed by measurements within 24 hours of the experiment
initiation.
Embodiments described herein represent improvements made to a cadmium selenide
NafY protein
FeMo-co catalytic system (CdSe=NafY=FeMo-co) that produces hydrogen, such as
the system
disclosed in U.S. Patent No. 9,605,279, incorporated herein by reference in
its entirety. (6) The
improvements include surprising discoveries which enhance the commercial
viability of the catalytic
system.
In some embodiments, hydrogen production by the CdSe=NafY=FeMo-co system
disclosed herein
can be greatly enhanced by one or more of:
- illumination wavelength (e.g., peak wavelength about 400-550 nm, or about
425-525 nm, or that
of blue LED or royal blue LED) and intensity (e.g., about 18,000 to 1,200,000
lux, or about 50,000 to
800,000 lux);
- availability or source of protons as feedstock (e.g., one or more of
dithionite, acetic acid, ascorbic
acid, citric acid, and/or carbon dioxide dissolved in water); and/or
- integrity of the components (e.g., ratio of the components to one another).
Surprisingly, the ratio of CdSe to NafY-FeMo-co has been found to have an
effect on catalyst
integrity and duration of hydrogen production. The samples are illuminated
with LED specific
wavelength in the visible light spectrum or can be illuminated with sunlight.
In different
embodiments the NafY-FeMo-co concentration can be varied so that the ratio
between CdSe and
NafY-FeMo-co can be 1:2, 1:3, 1:4 or 1:5. The higher the excess amount of NafY-
FeMo-co to the
CdSe results in longer sustained electronic properties and homogeneity of
solution. This also directly
results in lower rates of hydrogen production per CdSe loading. Higher loading
of feedstock can be
tolerated by the catalyst to the point that the diminished rate has been
partially countered with
higher feedstock loading.
Another surprising discovery is that additional excess loading of electron
donor ¨ spiking of
dithionite Na2S204, may over a period of time jeopardize the integrity of the
catalytic system. As
such, maintaining a sufficiently low concentration of dithionite and/or use of
alternative or
8
CA 03093818 2020-09-11
WO 2019/178189
PCT/US2019/021991
additional proton donor may be desirable. One reason hydrogen generation may
have ceased was
because the electron source was consumed. Spiking of the samples was done with
sodium
dithionite to provide more protons and electrons (because the dithionite acts
both as a reductant
and also reacts with water in its monomer form to produce protons); however,
after several weeks
of running the sample in front of the light samples, both halogen and LED
lights, it was proposed that
the sodium dithionite itself may have jeopardized the catalyst itself. It was
proposed that the
sodium dithionite may have been interacting with the nanoparticle surface
leading to surface
defects. Rather than photoexcited electrons participating in electron transfer
to the adsorbed NafY-
FeMo-co to facilitate proton reduction, the electrons may have undergone
recombination. The
source of protons and electrons was the reagent sodium dithionite (Na2S204).
Increasing
concentration of this source had been shown to increase hydrogen production.
Samples were
"spiked" with an additional injection of sodium dithionite to bring the
concentration back to 2 mM
or greater on the third or fourth or fifth day. The dithionite (5204-2), a
dimer, is known to be in
equilibrium with its monomer form (502), a sulfur dioxide radical. It is this
monomer that reacts
with the water to form protons shown by the reaction sequence below. The
presence of sodium
dithionite in the reaction mix also serves to be an oxygen scavenger to
maintain the anaerobic
environment, in addition to being a sacrificial electron donor to fill the
exciton hole formed as a
result of photo-activation of the CdSe nanoparticle (13).
k,
2S0-,
SO2 H,0 ____________ HSCY-3 Ff e
f,
HSO 3 S023-
Kõ = [S 20 42 ]1[SO ,]2
Without wishing to be bound by theory, it is believed that dithionite binds to
the surface of the
nanoparticle and may contribute ligand effects. The suggestion is that the
catalyst undergoes
changes from what it is originally after sample set up and that these changes
are observed in the UV-
vis spectra, the actual appearance of the catalyst solution, and the measured
amount of hydrogen
produced. The role that sodium dithionite plays in those changes can be
explored with nanoparticle
surface characterization techniques such as TEM (14). In an embodiment,
maintaining a level of
electron and proton donor concentration may be achieved using other sources
than sodium
dithionite, such as acetic acid, ascorbic acid, citric acid, and carbon
dioxide dissolved in water.
In embodiments, the system undergoes a spectral change that has some
correlation to the higher
rate of hydrogen production.
9
CA 03093818 2020-09-11
WO 2019/178189
PCT/US2019/021991
In embodiments, hydrogen generation can be turned on and off by addition or
removal of a light
source.
In embodiments, the stability of the system can be enhanced by the presence of
the protein
component.
Certain advantages of the presently disclosed CdSe-NafY-FeMo-co system over
other hydrogen
generation methods are summarized below.
Hydrogen generation method Advantage of CdSe-NafY-FeMo-co system of the
present
disclosure
Steam reforming 1. Ambient temperatures and pressures.
2. Produces pure hydrogen that will not poison fuel cell catalyst
because of the enzymatic component in the reaction.
3. Green energy; no carbon footprint.
Electrolysis 1. Demonstrated duration up to 39 days.
2. Electrodes in electrocatalytic solutions corrode within a few
days. (18)
3. Large overpotentials are required to split water. There is no
economic advantage of producing hydrogen for electricity used,
when the electricity is supplied by the grid.
Methods using platinum 1. The nanoparticle used is comprised of an
abundant earth
metal. It is readily synthesized and functionalized. It is low cost
relative to platinum.
2. The CdSe nanoparticles are reliably photo-active and are shelf
stable in aqueous solution for six months or longer.
Methods using a nanoparticle 1. This method uses FeMo-co extracted from
nitrogenase and
and hydrogenase performs a unidirectional reaction. Hydrogenase is
bidirectional,
meaning as soon as hydrogen is formed, the reverse reaction
starts. (19)
2. MoFe protein from nitrogenase is homologously recombined
into its host organism, Azotobacter vinelandii. The genes for
hydrogenase are heterologously recombined into E. coli and the
bacterial growth yields are considerablly smaller than that for
MoFe protein. This is very important for scaling up (20).
3. Some methods use TiO2 with a photosensitizer such as a
ruthenium complex coupled with hydrogenase. The TiO2
responds best to UV light and can damage the protein.
CdSe-NafY-FeMo-co is a much more stable system (10).
Algae farm to produce biofuel At current rates of hydrogen production and
with scaling up, the
volume needed to produce 44 kg H2/day would be 12 ft x 12 ft x
12 ft = 1728 ft3. This amount of hydrogen in an FCEV would be
enough to fill nine cars and each has the capacity to go 350 miles.
To produce the same amount of biofuel to run a car engine, an
algae farm would require 7 acres of raceways, which is equivalent
to an area of 304,920 square feet - 552 ft by 552 ft. (21)
CA 03093818 2020-09-11
WO 2019/178189
PCT/US2019/021991
EXAMPLES
Aspects of the present disclosure may be further understood in light of the
following examples,
which should not be construed as limiting the scope of the present disclosure
in any way.
Example 1. Preparation of hydrogen generation reaction components
In an embodiment, the components that comprise the catalyst were assembled.
Azotobacter
vinelandii cells were genetically engineered by attaching a polyhistidine tag
to the C terminus of Nif
D of the Nif DK gene that codes for the MoFe protein, Component I of the
nitrogenase enzyme. This
gene construct is identified as DJ 995 (8). The MoFe protein was anaerobically
purified by cell wall
lysis and by way of zinc charged immobilized metal affinity column and ion
exchange column liquid
chromatography. The iron molybdenum cofactor (FeMo-co) was acid extracted and
was dissolved
into an organic solvent, N-methylformamide, under strict anaerobic conditions
(9).
An inexpensive light harvesting material, cadmium selenide, was synthesized
and functionalized by
exchanging capping agents trioctylphosphine for mercaptosuccinic acid to allow
for aqueous
solubilization, (CdSe-MSA) (10). The NafY-FeMo-co was combined under strict
anaerobic conditions
in a Millipore concentrator. The concentrated NafY-FeMo-co solution was added
to a crimped seal
sample vial with an inert atmosphere. The same number of moles of CdSe-MSA
were added to the
vial and the catalyst underwent self-assembly. See Figure 1 for graphic of the
hydrogen generation
system. Thirty minutes later the solution was brought to 2.0 mM sodium
dithionite, (Na2S204). UV-
visible absorption spectra were measured of the samples and baseline
corrected. The samples were
put in front of the LED panels. Temperature was monitored. Head space samples
were drawn
roughly every 24 hours or multiple day intervals and injected into a gas
chromatograph. One day is
roughly 24 hours.
In an embodiment, a baseline of hydrogen production was established with
reaction components
using new equipment, Azotobacter vinelandii cells, newly synthesized and
functionalized cadmium
selenide particles was initiated as described herein. These validation
hydrogen production values
were calculated assuming one mole of catalyst, CdSe-NafY-FeMo-co at 0.014 kg
H2/mol catalyst/day.
In an embodiment, the experimental conditions were as follows. 2.0 u.M CdSe-
NafY-FeMo-co in 25
mM Tris, 2.0 mM Na2S204samples were set up and thoroughly degassed using a
Schlenk line
apparatus. Optimization sets of experiments were run with the same catalyst
concentrations except
for a set in Optimization Set J, which had 10 mM Na2S204, which acts as the
sacrificial electron
donor. The hydrogen generation rate of the CdSe-NafY-FeMo-co system increased
from a validation
11
CA 03093818 2020-09-11
WO 2019/178189
PCT/US2019/021991
rate of 0.014 kg Hz/mol catalyst/day to an average of 44.1 kg Hz/mol
catalyst/day in Optimization Set
AA in the samples with 10 mM Na2S204. This is identified as a "burst" rate
that typically is not
sustained beyond the measurement at 24 hours since experiment initiation.
This rate increase was calculated assuming there is one mole of catalyst and
that there is one to one
scale up potential of the system. The system has already undergone one scale
up achievement in
going from a 1.5 mL volume of components to a 2.5 mL volume with corresponding
increase overall
of hydrogen production.
Shown in Figure 2 and Table 1 are a graphical and a tabular representation of
the rate increases
since the validation sets of experiments that set a baseline followed by
Optimization sets with
corresponding increases in hydrogen production.
Table 1. Experimental set label, reaction rates, and concentration of sodium
dithionite.
Hydrogen production per one [Na2S204]
mole catalyst
Validation ¨ 0.014 kg Hz/day 2 mM
Optimization Set A ¨0.15 kg Hz/day 2 mM
Optimization Set D¨ 0.49 kg Hz/day 2 mM
Optimization Set H ¨0.56 kg Hz/day 2 mM
Optimization Set I - 1.05 kg Hz/day 2 mM
Optimization Set J¨ 1.77 kg Hz/day 2 mM 15
Optimization Set J ¨ 13.0 kg Hz/day 10 mM
Optimization Set Y ¨ 20.2 kg H2/day 10 mM
Optimization Set AA ¨44.1 kg H2/day 10mM
Example 2. Effect of various wavelength and intensity of LED lights
illuminating hydrogen
generation samples
Initially hydrogen generation samples were set up in the validation phase
illuminated by a 500-watt
halogen lamp. Optimization sets were set up in front of LED lights, first each
vial on a single white
LED, and then next in front of specific wavelength LED panels with 232
individual LED lights
embedded over 3 inches x 8 inches area and attached to a power source, which
allowed for
adjustment of brightness (intensity). Use of the specific wavelength LEDs led
to understanding that
installing the samples in front of the more energetic (lower) wavelengths led
to higher hydrogen
production.
Samples were situated so that they are illuminated from both sides (front and
back), by an LED
panel. Royal blue (peak wavelength of 425 nm) LEDs have been shown to yield
high level hydrogen
12
CA 03093818 2020-09-11
WO 2019/178189
PCT/US2019/021991
production at a combined intensity of 80,000 lux with the highest rate of
production measured at an
average of 44.1 kg H2/mol catalyst/day at 8 hours of light exposure with a 10
mM Na2S204. Blue
(peak wavelength of 460 nm) LEDs demonstrated the second highest hydrogen
generation so far
with an intensity measurement of 300,000 lux in combination for the
Optimization Set J with 10 mM
Na2S204 measured at 24 hours, mentioned previously.
Various light wavelengths and intensities were applied to sets of 2.0 p.M CdSe-
NafY-FeMo-co in 25
mM Tris, 2.0 mM Na2S204samples using identical components from the same
batches to illustrate
that higher energy LEDs result in higher hydrogen production rates. Samples
for green (525 nm),
cyan (510 nm), white (460 nm with phosphor) and blue (460 nm), LED lights were
maintained within
.. the desired temperature range (22 - 26 C) by the use of air circulation
with fans. The royal blue (425
nm) LEDs required the use of a TECA Peltier cooling plate to maintain the
desired temperature. In an
embodiment, the samples in front of the royal blue LEDs demonstrated the
highest hydrogen
generation rates when all other variables were the same. In an embodiment,
blue outcompetes
white light. White light and cyan lights yield similar hydrogen production.
The results are shown
.. graphically in Figure 4. Note that the average of each light set is shown
with the dotted line. The
solid line shows the highest producing sample. In an embodiment, the higher
producing sample
within a sample set corresponded to its position in front of the LED light
panel. Samples on the ends
tended to get less overall light exposure and did not produce as much
hydrogen.
Example 3. Spectral changes observed during the course of hydrogen generation
experiments.
The conclusion that the royal blue LED lights yield greater hydrogen
production were observed;
however, changes in appearance observed in the samples themselves were
noticeable by eye and by
spectral changes. Two characteristic changes were observed in the UV-vis
spectra. Typically, within
the first 24 hours there was a ¨ 10 nm red shift in the absorption spectrum.
This red shift would also
correspond to an increase in hydrogen production. By eye, there was a color
change in the sample.
Second, over a few days illumination there was a diminishing in the absorbance
and started a
degradation process leading to precipitation of the quantum dots. If the
absorbance decreased by
half or more than this signaled a decrease in hydrogen production. It is
hypothesized that the
spectral changes observed may be associated with the Na2S204 loading and its
effects on the surface
of the nanoparticle by contributing to ligand effects and thereby surface
defects, which are known to
diminish electron transfer to surface adsorbed molecules by means of
recombination of excited
electrons. To illustrate, Figure 5 shows two different samples and the UV-vis
spectra taken over a 15-
day run with the same experimental conditions except for the wavelength LED
illuminating the
sample. Both samples show the red shift. The sample in front of the royal blue
LED panels has a
13
CA 03093818 2020-09-11
WO 2019/178189
PCT/US2019/021991
noticeable absorbance decrease as compared to the sample in front of the white
LED panels. In an
embodiment, a set of conditions regarding LED illumination can both achieve
optimal hydrogen
generation and at the same time preserve the sample integrity of the catalyst
to further enhance
time length of performance. The blue LED or even white or cyan LEDs at higher
intensity may
achieve high hydrogen production with improved sustainability.
Enhancing hydrogen production can also be achieved through the use of other
electron/proton
donor components that may have more advantageous ligand effects leading to
increased electron
transfer and resulting in higher hydrogen production.
Figure 5A and 5B show UV-vis spectra of Optimization Set I samples. Samples
above (Figure 5A)
were illuminated with white LEDS and show sustained absorbance until Day 15
and continuous
catalytic function to produce hydrogen. Samples below (Figure 5B) were
illuminated with royal blue
LEDs with pronounced decrease in absorbance at Day 6 which have its effects on
catalytic
performance.
In conclusion, exposure to higher energy LED source light, appeared to
accelerate the surface
changes of the nanoparticle indicated by the red shift followed by diminishing
absorbance and
thereby contributing to the catalytic degradation.
Example 4. Intensity variations in experiments and corresponding hydrogen
production values.
Intensity can have a significant effect upon rates of hydrogen generation. In
an embodiment, two
sets of samples were set up with identical conditions: 2.0 u.M CdSe-NafY-FeMo-
co in 25 mM Tris, 2.0
.. mM Na2S204. The plots shown in Figure 6 were the results of the white LEDs
at 80,000 lux vs the
maximum lux achieved using fans to cool the lights and samples to an
acceptable range. The data
plotted in the solid black line was the high producing sample and the dotted
line the average of the
80,000 lux experiment under white LED light. The data plotted in grey solid
and dotted lines were
the result of increasing the intensity to 328,000 total lux for the same white
LEDs.
In an example shown in Figure 7, higher intensity results in higher hydrogen
generation rates. Blue
LEDs were placed at maximum intensity with the aid of a cooling plate to
maintain an acceptable
range of temperature at the samples. Also note here that while the intensity
increased was roughly a
4-fold increase from 80,000 total lux to about 328,000 total lux, the amount
of hydrogen generated
was more than a 4-fold increase for the first several days of the experiments.
Again, note that the higher intensity of Blue LED light produces a higher
amount of hydrogen. Here
the effect of intensity on amount of hydrogen produces is closer to a linear
response.
14
CA 03093818 2020-09-11
WO 2019/178189
PCT/US2019/021991
Example 5. Changes in ratios between reaction components and their effects on
duration of
hydrogen production.
The purpose of the work described is to increase hydrogen production and to
sustain the hydrogen
production for 30, 60, and 90 days. As noted, a more energetic (shorter
wavelength) LED light
source and increased intensities (brightness) lead to higher hydrogen
production. This can also be
problematic because the degradation of the catalyst in colloidal solution is
accelerated with more
energetic and intense LED light conditions. Changes in ratios of components
were made to sustain
the catalyst integrity using the more extreme conditions of high energy and
high intensity LEDs. For
instance, samples are shown in Figures 8A, 88 and 8C in a side by side
comparison of different ratio
components in front of royal blue LEDs. Figure 8A shows UV-visible
spectroscopic data from
Optimization Analytics 1 with a 1 to 1 ratio of components in front of high
intensity royal blue LEDs.
The catalyst sample has precipitated by 24 hours; however, roughly 20.5 kg
Hz/mole catalyst/day
was measured at 24 hours. Precipitation occurred in the first 24 hours as a
result of the harsh
conditions of LED illumination and high 10 mM Na2S204 loading as illustrated
by the severely
diminished absorbance spectra on Day 1 and Day 2. Figure 88 shows Optimization
AJ with a 1:2 ratio
of CdSe to NafY-FeMo-co and Figure 8C shows Optimization AM with a 1:3 ratio
CdSe to NafY-FeMo-
co both with half intensity LED conditions compared to the Optimization
Analytics 1 set. The 1:2
ratio sample, Optimization AJ, sustained its absorbance until significant loss
of absorption occurs
beyond Day 4 of light exposure and nearly no absorption occurring beyond Day
14. The 1:3 ratio
sample, Optimization Set AM showed spectral evidence of sustained absorbance
through Day 10
with significant absorbance observed at Day 29.
Hydrogen production for Optimization sets AJ and AM are shown in Figure 9A and
98. Figure 9A is a
plot of total amount of hydrogen produced during the sustained time period of
16 days for Set AJ
and for 29 days for Set AM. The rate of production is plotted in Figure 98 for
both sets. Typically, as
observed is a high peak rate during the first 24 hours with Set AJ. Set AM
does not show the peak
rate; however, a sustained rate of production is achieved for 29 days.
Ultimately, note that the 1:2
ratio sample initially outperformed the 1:3 ratio sample with an initial, non-
sustained burst rate, but
that the 1:3 sample outperformed the 1:2 ratio samples with duration and
higher rate of production
beyond 10 days of light.
In conclusion, with high energy wavelength lights, excess amount of NafY-FeMo-
co to the CdSe
results in longer sustained electronic properties and homogeneity of solution.
Furthermore, steady
rate of hydrogen generation can be achieved with high energy wavelength light
with higher NafY-
FeMo-co loading vs the CdSe component.
CA 03093818 2020-09-11
WO 2019/178189
PCT/US2019/021991
Longer wavelength LED light (less energetic) comparison data also show that
increasing the NafY-
FeMo-co component concentration compared to the CdSe component results in
increasing the
duration of the sample performance for hydrogen production and sustaining the
catalyst as
observed in the UV-vis spectra.
For example, sample set AG with 3 samples at 1:1 ratio (5 nmol each), 3
samples at 1:5 ratio* (1
nmol CdSe, 5 nmol nafY-FeMo-co) were set up in front of white (blue (460 nm)
with phosphor filter).
Asterisk denotes the different ratio, but the atypical amount of CdSe in
sample solution compared to
other samples. Sample Al with 3 samples at 1:2 ratio (5 nmol CdSe to 10 nmol
NafY-FeMo-co). All
these samples were run with 2 mM acetic acid and 1 mM Na2S204 target. The UV-
vis data are shown
in Figures 10A through 10C.
Sample sets shown in Figures 10A and 1013 were 2 u.M CdSe, 2 u.M NafY-FeMo-co,
5 mM NaCI, 1 mM
Na2S204, 2 mM acetic acid. Sample set shown in Figure 10C was 1:5 ratio with1
u.M CdSe, 5 u.M
NafY-FeMo-co, 5mM NaCI, 1 mM Na2S204, 2 mM acetic acid. Note that the 1:1
ratio samples (AG)
were severely diminished by Day8 (Figure 10A); the 1:2 ratio samples (Al) were
diminished by Day 20
with nearly no absorption by Day 37 (Figure 1013); and the 1:5* ratio samples
(AG') retained the
majority of the spectral features (retained original electronic properties)
through Day 25 (Figure
10C).
Hydrogen gas production was measured by gas chromatograph and because the 1:5*
ratio samples
had a lower CdSe loading, the overall trend is not direct. Only two of the
three sets of samples can
be compared at a time rather than the three altogether. Overall, the 1:1 ratio
samples (AG)
produced more hydrogen than the 1:2 ratio samples (Al) than the 1:5* ratio
samples (AG'). However,
when comparing 5 nmol CdSe : 5 nmol NafY-FeMo-co (1:1 ratio) and the 1 nmol
CdSe : 5 nmol NafY-
FeMo-co (1:5* ratio) it is observed that they have nearly identical
extrapolated rates of hydrogen
generation of kg H2/ 1 mole CdSe/ 1 day (See Figures 11A and 116).
The 5 nmol CdSe : 5 nmol NafY-FeMo-co (1:1 ratio) has a higher rate of
hydrogen production than
the the 5 nmol CdSe : 10 nmol NafY-FeMo-co (1:2 ratio) as measured as
extrapolated rate per 1 mole
CdSe.
In conclusion, for samples in front of white LED lights, the higher the excess
amount of NafY-FeMo-
co to the CdSe results in longer sustained electronic properties and
homogeneity of solution. Since
feedstock solutions were not increased accordingly this meant that it resulted
in lower rates of
hydrogen production with the higher ratio NafY-FeMo-co to CdSe components. The
essential point
demonstrated here was the ability to maintain the integrity of the catalyst
observed by the sustained
16
CA 03093818 2020-09-11
WO 2019/178189
PCT/US2019/021991
rate of hydrogen production and the spectral data not diminishing.
Another LED wavelength, cyan at 510 nm with high intensity at ¨ 350,000 lux in
total illumination of
the samples showed similar results. Once again, the CdSe component is listed
first in the ratio sets.
Sample set AK with 2 samples at 1:1 ratio (Figure 12A), 2 samples at 1:2 ratio
(Figure 126). Sample
set AL with 3 samples at 1:3 ratio (Figure 12C). Sample set AO with 3 samples
at 1:4 ratio (Figure
12D). The sample sets had varying sacrificial electron and proton donors. Sets
AK and AL were run
with 4 mM acetic acid and 2 mM Na2S204target. Set AO had 100 mM Na2S204
target.
The UV-vis spectral data showed the following. Note that the 1:1 ratio sample
is severely diminished
beyond Day 4, the 1:2 ratio samples diminished beyond Day9, the 1:3 ratio
sample diminished by
Day 12", and the 1:4 ratio sample has not reached a critical decline yet as of
Day 9. The apostrophe
notes, days with 'and ", indicate one period of darkness for each.
Hydrogen generation data shows in Figure 13A total amount of hydrogen
produced. Sets AK and
Sets Al approach the same totals of hydrogen produced at later days but the
catalyst holds up and is
intact for longer day periods. Higher feedstock of sacrificial electron and
proton donors may yield
higher rates and longer hydrogen production results.
As seen in Figure 1313, the 1:1 ratio sample set produce the most hydrogen
initially with the highest
rate, but this is a burst rate that is not sustained. The 1:2 and 1:3 ratio
samples require a bit more of
a ramp up time before reaching maximum rate. Both sets settle into a steadier
rate with the 1:2
ratio samples reaching a higher peak rate and sooner than the 1:3 ratio
samples. The 1:4 ratio
samples have no acetic acid, but have a much, much higher Na2S204 loading.
These samples reach
peak rate faster than the 1:1 ratio samples, but at a much lower rate. These
samples do not go
through a peak burst rate, but do settle into a steady rate immediately.
In conclusion, the higher the excess amount of NafY-FeMo-co to the CdSe
results in longer sustained
electronic properties and homogeneity of solution. This also directly results
in lower rates of
hydrogen production. Higher loading of feedstock can be tolerated by the
catalyst to the point that
the rate diminish could be countered with higher feedstock loading.
Blue (460 nm) LED light samples showing a 1:1 ratio sample set compared to a
1:4 ratio sample set
under ¨300,000 lux total illustrates similar results as with other wavelength
lights. Sample set L
with 2 samples at 1:1 ratio is shown in Figure 14A. Sample set AN with 3
samples at 1:4 ratio is
shown in Figure 1413. Feedstock loading for both sets were run at 10 mM
Na2S204target.
The spectral data show that the 1:1 ratio samples were nearly fully
precipitated within 1 day of light
17
CA 03093818 2020-09-11
WO 2019/178189
PCT/US2019/021991
while the 1:4 ratio samples were still abundantly in solution after 22 days of
light comparing Figure
14A and 1413.
In Figure 15A, it is noted that although the 1:1 ratio samples have a much
higher rate of hydrogen
generation, the rate is unsustainable and the catalyst is non-homogenous
within a few days of light.
The 1:4 ratio samples have almost no spike rate of generation and start
immediately into a sustained
rate of hydrogen generation within 24 hours of light.
In conclusion, for the purpose of extending the duration of the reaction, the
higher the excess
amount of NafY-FeMo-co to the CdSe results in longer sustained electronic
properties and
homogeneity of solution as is shown in Figure 15B. Lower rates of hydrogen do
result however
increasing the concentration of the feedstock may increase the sustained rates
of production.
Example 6. Demonstration of continuous hydrogen production for extended time.
In an embodiment, extending the duration of the hydrogen generation may be a
priority for
commercial viability. In one study, Optimization Set B, the experimental
conditions were as before.
The plot in Figure 16A shows a continuous steady rate of production until day
39. In Optimization
Set E shown as the plot in Figure 1613, the continuous steady rate of
production was demonstrated
for 30 days. One impressive and surprising feature of this system is its
longevity compared to other
photo-catalytic systems with enzyme components. When hydrogen production with
biohybrid
photocatalytic systems are measured in minutes or hours (11, 12) as is seen in
scientific literature, in
contrast the CdSe-NafY-FeMo-co system has the ability to run for multiple
weeks. The hydrogen
production may cease when the electron or proton donor runs out or the
catalyst precipitates. In an
embodiment, additional loading of the present proton donor ¨ spiking of
Na2S204, may over a period
of time jeopardize the integrity of the catalytic system.
Example 7. Demonstration of hydrogen generation experiment's ability to be
turned on and off
and on again without diminishing hydrogen production.
In an embodiment, addition or removal of the light source performs as an on-
off switch. A set of
samples were set up with these conditions: 2.0 u.M CdSe-NafY-FeMo-co in 25 mM
Tris, 2.0 mM
Na2S204. The samples were put in front of the broad spectrum halogen light for
one day and then
removed to the dark for five days. Throughout the time period, the samples
were exposed to light
and then dark. The data shows that intervals of no light of 2 to 53 days can
halt hydrogen
generation without loss of activity of the catalyst after light exposure is
resumed. One "Day" is ¨24
hr as shown in Figure 17A and Table 2.
18
CA 03093818 2020-09-11
WO 2019/178189
PCT/US2019/021991
The "Light" samples have shown that hydrogen production can be initiated and
ceased at varied
stages of duration in hydrogen. The small amount of hydrogen created after
"removing from light
exposure" is likely due to the none immediate removal of light. The samples
are left open to ambient
light during GC analysis. A relaxation period is to be expected for the CdSe
quantum dots as well.
The "Dark" samples have shown that no hydrogen production will occur if no
light exposure is given
to the catalytic mixture shown in Figure 1713 and Table 3. There is precedence
that the reaction
mixture has excellent shelf-life. After three days of light exposure the
amount of hydrogen
generated is quadruple what the "Light" samples had produced with the same
amount of light
exposure.
Table 2. "Light" Samples Data
Days Meas., Days Days Days Days Days Days Days Days Days Days Days
from Ca lc. Avg of of of of of of of of of
of of
Setup nmol H2 Light Dark Light Dark Light Dark Light Dark Light Dark
Light
0 0 0
_
1 1 1
-
7 8.7 1 6
_
8 24.4 1 6 1
_
11 34.2 1 6 1 3
_
14 112.2 1 6 1 3 3
-
17 106.6 1 6 1 3 3 3
-
22 82.8 1 6 1 3 3 8
25 279.5 1 6 1 3 3 8 3
_
54 279* 1 6 1 3 3 8 3 29
_
56 1242.4 1 6 1 3 3 8 3 29 2
-
69 1152.5 1 6 1 3 3 8 3 29 2 14
_
72 2331.9 1 6 1 3 3 8 3 29 2 14 3
* value is assumed, not measured.
Table 3. "Dark" Samples Data
Days Meas., Days Days Days Days Days Days Days Days
from Ca lc. Avg of of of of of of of of
Setup nmol H2 Dark Light Dark Light Dark Light Dark Light
0 0 0
1 0 1
7 0 7
8 3 7 1
10 100.6 7 3
14 92.0 7 3 4
17 93.5 7 3 7
22 84.8 7 3 12
24 94.0 7 3 12 2
19
CA 03093818 2020-09-11
WO 2019/178189
PCT/US2019/021991
54 94* 7 3 12 2 30
57 134.3 7 3 12 2 30 3
69 157.9 7 3 12 2 30 3 13
71 397.3 7 3 12 2 30 3 13 2
76 519.8 7 3 12 2 30 3 13 7
* value is assumed, not measured.
Incubation. In an embodiment, as in the previous samples, there appeared to be
a benefit to the
samples spending some time in the dark. Hydrogen production was enhanced for a
period of time
after the samples returned to the light.
Conclusions from these studies point to samples that have been exposed to
light and initiate
hydrogen production can be deactivated when light exposure is ceased.
Furthermore, samples that
have never seen light will not initiate hydrogen production without light
exposure.
Some other samples that spent time away from the light are instructive.
Optimization Set A Samples were set up to investigate the possible positive
effects of incubation on
hydrogen gas production. After setup, three samples (LED Samples) were placed
on the broadband
LED light (Figure 18A), while two samples were put in the dark. One Delayed
Sample was a non-
responsive, so only one viable sample represents the Delayed Samples. The
total hydrogen was
measured at different time intervals. The rate of hydrogen production was
calculated from total
measured hydrogen, catalyst loading, time lapse as kg H2 per mole of catalyst
per day.
Delayed light exposure or initial incubation did produce more total hydrogen
however since there
was only one sample one cannot conclusively say that incubation or spending
time in the dark
enhances hydrogen production. Later, the LED samples were removed from light,
put into darkness
for 53 days. Hydrogen generation was resumed when the samples were provided
light again after 53
days of darkness. The total measured hydrogen is graphed in the following
plots. Figure 19A shows
total hydrogen vs days since setup. Note that no significant hydrogen was
produced over the 53 days
of darkness. Plot in Figure 1913 is total hydrogen vs days of light. Note that
the hydrogen production
appears seamless when the interval of the dormancy period is removed from the
plot.
Comparing the amount of hydrogen produced before and after the 53-day
dormancy, plotting the
total amount of hydrogen produced vs days of light and treating Day 65 as a
second Day 0 (setup
day), the following graph results (Figure 20A). Note that the overall rate of
hydrogen production
after dormancy was less than the initial rate of production with initial light
exposure after the true
setup. When comparing the rate of production just before the samples went into
dormancy vs just
after (Figure 2013), there is a small increase in rate. However, this trend is
common for most sample
CA 03093818 2020-09-11
WO 2019/178189
PCT/US2019/021991
sets where the initial rate of hydrogen generation tapers after an initial
decrease.
In conclusion, a dark-incubation or dormancy period, defined as having the
samples in darkness
immediately after setup with feedstock present, did not result in higher
producing hydrogen
generation. A dormancy period of 53 days (mid experiment incubation period),
also did not increase
hydrogen generation rates; however, sample set up followed by time spent in
the dark and time in
the dark for 53 days, surprisingly does not diminish the hydrogen generation
capability of the
catalyst.
Incubation in the dark produced some interesting spectral data. It has been
recognized that higher
energy (shorter wavelength) light can damage the nanoparticles and therefore
jeopardize the
function of the catalyst for long-term hydrogen generation. Interesting data
from samples put in
front of the most energetic LED light source comparing samples given some
incubation time and
those put immediately in front of the LEDs after experimental set up present
the following data.
There were three samples placed at Royal Blue LEDs immediately after setup (G
samples seen in
Figure 21A). Three samples were placed into darkness immediately after setup
(G' samples seen in
Figure 21B). On Day-12 from setup, the Dark samples were taken from darkness
and placed in front
of Royal Blue LEDs (Figure 21C).
G Samples had significant spectral changes within first 9 days of light
exposure and hydrogen
generation.
G' Samples in darkness had red shift, but no loss in absorbance. The G'
samples maintained spectral
integrity once given 9 days of lighto
Comparison of the hydrogen generation of these sets are of interest; however,
the samples that
went directly onto the light for hydrogen generation outperformed the samples
that were in
darkness/ incubating for 12 days prior to light exposure/hydrogen generation
(Figures 22A and 22B).
Note: Colored precipitate started to appear on Day-3 for Samples Royal Blue
1,2,3. Culminated in
ribbon-like deposit at rim. However, the Dark samples when placed at the Royal
Blue LEDs colored
precipitate was not observed through the 9 days of monitoring.
In conclusion, there was no increase in rate of hydrogen generation observed
for samples that are
incubated in darkness for 12 days; however, the samples spending time in
darkness showed spectral
integrity was maintained and therefore the likely benefit of incubation would
be effective in long-
term stability for maintaining homogeneity.
21
CA 03093818 2020-09-11
WO 2019/178189
PCT/US2019/021991
More data from various sample sets point to the conclusion that spending time
in a dormant state or
in the darkness do not impede hydrogen production once the samples are exposed
to the light. This
applies to different wavelength LED lights as observed to these samples in Set
R that were put in
front of cyan LED lights (510 nm). Samples were placed in front of Cyan LEDs
for hydrogen
generation of 9 days. Then the samples were placed in darkness for 9 days. The
samples were
returned to the Cyan LEDs for 6 more days. Total hydrogen produced is shown in
Figure 23A. The
days of light compared with hydrogen production is shown in Figure 236.
Interestingly, spending
time in the darkness does not diminish sample sets from producing hydrogen
once they are returned
to the light.
In conclusion, the 9-day lapse in light did not affect the overall production
of hydrogen. Note that
the observed drop in overall hydrogen measured is likely due to a leak in the
septum.
Once more, cyan lights demonstrated repeatable data pointing to varying amount
of time spent in
darkness does not impair hydrogen production once they are returned to in
front of the LED lights.
Samples in front of Cyan LEDs were provided light for three continuous days
immediately after
setup. Then the samples were in darkness for three days, returned to lights
for four days, and
measured after more light exposure. No measurement was taken after the
duration of darkness. The
following total amount of hydrogen was produced and plotted vs total days of
light (Figure 24A) or
days since setup (Figure 246).
In conclusion, three days of darkness in the middle of a 10-day hydrogen
generation experiment
does not hinder the catalyst lifecycle of hydrogen generation.
Finally, as has been detailed, enhancing the duration of the hydrogen
generation is performed by
increasing the NafY-FeMo-co concentration and thereby setting a 1:3 ratio
CdSe:NafY-FeMo-co in
the catalyst. It's interesting to observe altered ratio samples undergoing a
period of darkness and
then a return to light conditions. Samples were placed in front of cyan LEDS
immediately after set
up. After 9 days of light the samples were in the dark for 19 days. The
samples were returned to the
LEDs for 4 days then back to the dark for three days. After 4 more days of
light the experiment was
ceased.
No significant loss in hydrogen production was observed. The steady
decline/plateau of rate was
observed regardless of the periods of no light and no hydrogen generation.
Figures 25A and 256
shown total amount of hydrogen produced. Figure 25C tracks the rate of
hydrogen production. The
effects of the altered ratio can be seen in the rate after then initial high
rate is observed typically in
the first 24 hours. Time spent in darkness during the experimental run did not
impede hydrogen
22
CA 03093818 2020-09-11
WO 2019/178189
PCT/US2019/021991
production once samples were returned to the lights. Additionally, the
positive effects of steady
hydrogen production arising from the increased ratio are demonstrated in the
steady state rates of
production.
In conclusion, the periods of darkness of 19 days, 3 days, or repeat periods
of darkness, do not affect
the overall trend/lifecycle of the catalyst that occurs during hydrogen
generation.
Example 8. Investigation of alternative proton sources
Investigation of alternative proton sources was performed in experiments with
addition of acetic
acid and ascorbic acid. Sodium dithionite vs sodium dithionite with ascorbic
acid vs sodium
dithionite with acetic acid illuminated with high intensity blue LED lights.
The plot in Figure 26
.. shows the CdSe-NafY-FeMo-co system (2 uM). All samples have 5 mM of sodium
dithionite (DT).
Samples OptP have only DT loaded. Samples OptQ have DT and a weak acid: AscA =
5 mM ascorbic
acid, AceA = 5 mM acetic acid. Note that sodium dithionite loading alone
produces a prominent
burst/non-sustained rate of hydrogen production while both ascorbic acid and
acid in addition to the
dithionite load behave similarly as a sustained rate of hydrogen production.
Samples were set up and put in front of lesser intensity blue lights to
investigate the use of acetic
acid further. All catalyst loadings are 1:1 ratio of CdSe:NafY-FeMo-co. All
samples exposed to Blue
LEDs (-460 nm) of ¨80,000 lux total. Samples OptZ -DT are loaded with only 0.5
mM sodium
dithionite. Samples OptZ ¨ DT&AceA are loaded with 0.5 mM sodium dithionite
and 0.5 mM acetic
acid. Figure 27 shows that under subdued light conditions and lesser
dithionite loading the samples
behave similarly with vs without acetic acid present and are able to establish
a sustained rate of
hydrogen generation.
Example 9. Stability of hydrogen generation experiment enhanced by presence of
protein
component.
In embodiments, stability of system enhanced by enzyme component presence was
demonstrated in
each sample set. The controls with CdSe nanoparticles (2 uM) with added sodium
dithionite (2 mM),
same concentrations as the hydrogen generation samples, in each sample set
have precipitated
within the first 24 hours. The enzyme component stabilized the CdSe-NafY-FeMo-
co system and kept
it operational toward hydrogen production. In embodiments, controls with added
NafY alone did
not produce hydrogen and precipitated at a slower pace than the control
samples with only CdSe.
The surface of the nanoparticle appears to be important to making the catalyst
robust toward
hydrogen production. In embodiments, all three components are necessary for
hydrogen
23
CA 03093818 2020-09-11
WO 2019/178189
PCT/US2019/021991
generation that is homogenous for 30+, 75+ days ¨ depending on the conditions.
Example 10. Additional optimization
An optimization strategy to further increase the rate of hydrogen production
and extend the
duration of the hydrogen generation process includes one or more of the
following:
A. Royal blue lights have resulted in a production rate of 44.1.0 kg
hydrogen/mol catalyst/day.
Efforts to determine if lower energy/higher wavelength LEDs with dialed up
higher intensities will
result in comparable or higher rates. In an embodiment, the integrity of the
catalyst is preserved
and photo-degradation of the sample is avoided to improve durability.
B. Determining alternative proton sources. Acetic acid and ascorbic acid have
been introduced to
the samples. Other weak acids such as citric acid can be introduced. These
sources may exhibit the
same or more hydrogen generation capabilities.
C. Analysis of the samples by TEM, ICP-MS, and FTIR. NM R and EPR are other
spectroscopic
techniques to attempt to best characterize the surface of the nanoparticles.
This can be performed
for the sample duration to observe and study the changes in the catalyst.
D. Once optimal conditions are analyzed and demonstrated then duration studies
can be set up.
The upper limit of sample duration can be further investigated.
E. An alternative method of extracting FeMo-co can also be used. A desalting
column can be
ordered to remove the salt, Bu4NBr. The FeMo-co is extracted into DMF,
dimethylformamide.
Hydrogen samples can be set up with this form of FeMo-co. The samples may
produce at the same
or better level of the NMF extracted FeMo-co. This may represent a major step
in scaling up the
process toward commercialization. (16)
F. Increasing the concentration of the components. H2 generation experiments
are possible with
increased CdSe-NafY-FeMo-co catalyst concentrations, e.g., 4 uM, 8 uM, 12 uM,
16 uM, 20 uM, 30
uM, 40 uM, 50 uM, or higher.
G. pH changes with sample system. Different buffering systems may be used such
as MOPS and
PBS. Solubility may vary with pH changes. The capping agent is of the CdSe
nanoparticle is
mercaptosuccinic acid (MSA). The pKa of the thiol group is 10.64 in MSA (17).
If the pH becomes too
acidic then enough thiol groups will dissociate from the surface of the
nanoparticle and the
nanoparticle will precipitate because they are no longer soluble in the
aqueous solvent.
H. In embodiments, various temperatures within the range of 16 to 32 C can be
used. In
24
CA 03093818 2020-09-11
WO 2019/178189
PCT/US2019/021991
embodiments, agitating the samples may improve hydrogen production.
Various aspects of the present disclosure may be used alone, in combination,
or in a variety of
arrangements not specifically discussed in the embodiments described in the
foregoing and is
therefore not limited in its application to the details and arrangement of
components set forth in the
foregoing description or illustrated in the drawings. For example, aspects
described in one
embodiment may be combined in any manner with aspects described in other
embodiments.
The phraseology and terminology used herein is for the purpose of description
and should not be
regarded as limiting. The use of "including," "comprising," or "having,"
"containing," "involving," and
variations thereof herein, is meant to encompass the items listed thereafter
and equivalents thereof
as well as additional items.
While specific embodiments of the subject disclosure have been discussed, the
above specification is
illustrative and not restrictive. Many variations of the disclosure will
become apparent to those skilled
in the art upon review of this specification. The full scope of the invention
should be determined by
reference to the claims, along with their full scope of equivalents, and the
specification, along with
such variations.
INCORPORATION BY REFERENCE
All publications, patents and patent applications cited above are incorporated
by reference herein in
their entirety for all purposes to the same extent as if each individual
publication or patent
application were specifically indicated to be so incorporated by reference.
References:
(1) www.popsci,comihow-hydrogen-vehicles-work
(2) www.caranddriver.comtnewqhopda-fcev-conc.:ept-news
(3) htties:ilcafcrp, olj...ilb I gg;
µ.vww.cafcp.orgiblogf32nd-livdrogen-station-opens-mountain-view-california
(4) al,1111c1D AZ,111111S,2111112a111Q2,11c2,1LIII:tgL,t1111111La-
lilif,'EtILlf,ililthaciLcIrilit
(5) Vincent Kylie A.; Parkin, Alison; Armstrong, Fraser A. Investigating and
exploiting the
electrocatalytic properties of hydrogenase. Chemical Reviews, 2007, 107, 4366-
4413.
(6) Maxwell, Deborah B. Methods and System for Photo-activated Hydrogen
Generation. U.S.
Patent No. 9,605,279. Issued March 28, 2017.
(7) King, Paul. Designing interfaces of hydrogenase-nanoparticle hybrids for
efficient solar
conversion. Biochimica et Biophysica Acta, 2013, 1827, 949-957.
(8) Christiansen J, Goodwin RI, Lanzilotta WN, Seefeldt LC, Dean, DR.
Catalytic and biophysical
properties of a nitrogenase Apo-MoFe protein produced by a nifB-deletion
mutant of
Azotobacter vinelandii. Biochemistry 1998; 37; 12611-23.
(9) Shah VK, Brill WI Isolation of an iron-molybdenum cofactor from
nitrogenase. Proc Natl Acad
Sci USA 1977; 74; 3249-53.
(10) Callan, Callan JF, Mulrooney RC, Kamila S. Luminescent detection of ATP
in aqueous solution
using positively charged CdSe-ZnS quantum dots. J Fluoresc 2008; 18; 1157-61.
(11) Reisner E, Powell DJ, Cavazza C, Fontecilla-Camps JC, Armstrong FA.
Visible light- driven H2
CA 03093818 2020-09-11
WO 2019/178189
PCT/US2019/021991
production by hydrogenases attached to dye-sensitized TiO2 nanoparticles. J Am
Chem Soc
2009; 131; 18457-66.
(12) Wilker, Molly B., Shinopoulos, Katherine E., Brown, Katherine A., Mulder,
David W., King, Paul
W., Dukovic, Gordana. Electron Kinetics in CdS Nanorod-[FeFe]-Hydrogenase
Complexes and
Implications for Photochemical H2 Generation. J Am Chem Soc 2014, 136, 4316-
4324.
(13) Mayhew, S. G. The redox potential of dithionite and SO-2 from equilibrium
reactions with
flavodoxins, methyl viologen and hydrogen plus hydrogenase. Eur J Biochem
1978; 85, 535-547.
(14) Junge, Henrik, Rockstroh, Nils, Fischer, Steffen, Bruckner, Angelika,
Ludwig, Ralf, Lochbrunner,
Stefan, Kuhn, Oliver, Beller, Matthias. Light to Hydrogen: photocatalytic
hydrogen generation
from water with molecularly-defined iron complexes. Inorganics, 2017, 5, 14, 1-
21.
(15) Brown Katherine A., Wilker, Molly B., Boehm, Marko, Dukovic, Gordana,
King Paul W.
Characterization of photchemcial processes for H2 production by CdS nanorod-
[FeFe]
Hydrogenase complexes. J Am Chem Soc 2012; 134, 5627-5636.
(16) McLean, Paul A. Wink, David A. Chapman, Stephen K., Hickman, Alison B.,
McKillop, Debbie
M., Orme-Johnson, William H. A new method for extraction of iron-molybdenum
cofactor
(FeMoco) from nitrogenase adsorbed to DEAE-cellulose. 1. Effects of anions,
cations, and
preextraction treatments. Biochemistry, 1989, 28, 9401-9406.
(17)Cheney, Graeme, Fernando, Quintus, Freiser, Henry. Some metal chelates of
mercaptosuccinic
acid. 1959. Doctoral Thesis. University of Pittsburgh, 2055-2057.
(18) .WW2LtlYatr2;LIII,c121111ItchlacLMI12112
(19) Melis, Anastasios, Happe, Thomas. Hydrogen production: green algae as a
source of energy.
2001, Plant Physiology, 2001, 127, 740-748.
(20) Burgess, Barbara, Jacobs, Deloria B., Stiefel, Edward I. Large-scale
purification of high activity
Azotobacter vinelandii nitrogenase. Biochimica et Biophysica Acta, 1980, 614,
196-209.
(21) www.energyfactor.exxonmobil.com/news/algae-heading-
farm/?utm_source=Exxon+Newsletter&utm_campaign=cdf2fbe2cc-
EMAIL_CAMPAIGN_2018_03_09&utm_medium=email&utm_term=0_591a587b0d-cdf2fbe2cc-
86945097
26