Note: Descriptions are shown in the official language in which they were submitted.
1
1 PROCESS TO INTEGRATE QUANTIFIED QUALITATIVE DATA INTO
2 ANALYTICS
3 Background of the Invention
4 Field of the Invention
The invention pertains generally to analytics. More specifically, the
invention relates to the process
6 of utilizing quantified qualitative data in analytics. The system is an
Intelligent Decision Support
7 Platform. The structural uniqueness of the system is the integration of
quantified data into a
8 plurality of business processes for decision-making using a dashboard to
present source data,
9 organize data, perform advanced operations and applying statistical
measures to the quantified
qualitative data. Then, using the results generated from categorical, nominal,
ordinal, interval and
11 ratio analytics to provide meaningful information for a user to write an
intelligent report with
12 meaningful results that is delivered to the client. This semi-automated
process will be automated in
13 future builds.
14 Internal documents providing science-based evidence that the results
obtained from the Intelligent
Decision Support Platform statistical processing of the quantified qualitative
dataset utilized is
16 repeatable have been maintained by Star-Ting Incorporated. The prototype
was completed
17 November 9, 2018.
18 An Intelligent Decision Support Platform is disclosed with business
process steps on how to
19 integrate quantified qualitative data into decision analysis. The
invention is flexible and can perform
statistical processing on quantified qualitative datasets on seven platforms
consisting of business
21 intelligence, competitive intelligence, decision support, risk
management, what-if scenarios, stand-
22 alone analysis or in multiple variations in an integrated analysis
package with future enhancements
23 identified.
24 The system utilizes a dashboard with numerical results from advanced
statistical operations and
statistical measures in graphical displays. The dashboard provides navigation
controls for each of
26 the seven platforms separately or combining platforms utilizing
different parts of the robust system.
27 The invention possesses numerous benefits and advantages over
traditional analytics. Data scientists
28 and/or managers have faced the problem of not being able to generate
consistent and repeatable
29 results on the qualitative data thereby leaving the qualitative dataset
underutilized. On November
15, 2018 searching the EBSCO host search engine resulted in Monte Carlo
referenced in 35,877
CA 3025302 2018-11-26
2
31 Academic Journals, 34,560 journals, 2,614 magazines, 8 conference
materials and 4 trade
32 publications which shows the of Monte Carlo is wide-spread.
33 Accessed on November 15, 2018, from https://semanticscholar.org, The
Division of Scientific
34 Computing, Dept. of Information Technology, Uppsala University in
Sweden, "A Monte Carlo
35 method needs a reliable way of generating random numbers. While it is
difficult to compute
36 perfectly random numbers, most generators compute pseudo-random numbers.
They mimic the
37 behavior of true random numbers and are generated in a deterministic and
predictable way."
38 "Monte Carlo simulations are used to model the probability of different
outcomes in a process that
39 cannot easily be predicted due to the intervention of random variables"
The use of Monte Carlo in
40 analytics relies on randomness "to solve problems that might be
deterministic in principle"
41 (Investopedia, 2017, Monte Carlo Simulation); however Monte Carlo does
not address the
42 subjective aspects and selects random numbers to solve problems without
a repeatable and
43 consistent process. Monte Carlo introduces a higher level of uncertainty
in the results. Contrary to
44 relying on Monte Carlos' randomness, the invention solves problems based
on source data framed
45 on proven principles for a repeatable and consistent process.
Traditional qualitative analyses,
46 methods and techniques are not repeatable or consistent, however
consistent and repeatable results
47 from analytics is desired. The invention utilizes a repeatable
methodology that incorporates
48 transformed data to perform analytics and extended analytics that are
consistent and repeatable.
49 Typical research methodology relies on survey questionnaires as
exemplified by the accepted
50 research by Emerald Insight on July 5, 2018 of author Vikas Kumar,
(Bristol Business School,
51 University of the West of England, Bristol, UK), "An empirical analysis
of supply and
52 manufacturing risk and business performance: a Chinese manufacturing
supply chain perspective".
53 Another methodology typically used are focus groups are typically used
to investigate research
54 objectives by means of quantitative analyses as seen in the research
paper dated 31 July 2018,
55 Authors: Anni-Kaisa Kahkonen , (School of Business and Management,
Lappeenranta University of
56 Technology, Lappeenranta, Finland), "Sustainable supply management
practices: making a
57 difference in a firm 's sustainability performance". Traditionally, the
level of measurement is limited
58 to empirical results on categorical analyses; thus, establishing that
utilizing quantified qualitative
59 data in analytics is an emerging, disruptive and revolutionary practice
for investigating and
60 performing analytics on qualitative data sets. Furthermore, when
analytics rely on secondary or
61 tertiary data or responses from surveys, questionnaires or focus groups
then increased systemic error
62 is introduced because experts can bring in human error, subjectivity,
personal opinions and bias
CA 3025302 2018-11-26
3
63 which can impact results adversely. Consensus leaves uncertainty as to
which choice was best.
64 Without an intelligent platform that addresses these issues to compare
qualitative data consistently
65 and repeatably, 100% of all decisions are made on only 50% of the data.
In contrast, this invention
66 utilizes a consistent, repeatable and reliable levels of measurement for
the analytics.
67 A practical application of the invention as an intelligent decision
support platform capable of
68 assisting with executive level and managerial problem-solving is making,
presenting and defending
69 a business case with science-based evidence. For example, in TP-0005-
MD&A-Securities on
70 August 8, 2018 test results indicated a very high level of uncertainty
in management existed with a
71 result of -3.73. Statistical outputs from the invention's advanced
operations and statistical measures
72 are used to determine what the appropriate level of liquidity and
capital for existing operations
73 should be, assuming no significant adverse changes in the markets in
which the corporation
74 operates. The invention's statistical processing helps management to
make science-based decisions
75 that can maintain balance sheet strength under normal market conditions.
The extended analysis can
76 help management make risk-informed decisions such as pinpointing areas
where the corporation
77 will have significant difficulty maintaining balance sheet strength as
highlighted under periods of
78 financial stress.
79 Another practical example of the invention as an intelligent decision
support platform was
80 demonstrated by the invention's results of the analysis of Bob Weber's
press release, "Oilpatch
81 could cut methane for near zero cost: study" published in the Calgary
Herald via the Canadian Press
82 on November 24, 2017. The invention's statistical processing returned on
November 3, 2018 a
83 statistical result of a 0.17% likelihood that the claim made by the
academic study in the TP-0001E-
84 Methane-Reductions test is realistic for industry to reduce emissions of
a powerful greenhouse gas
85 for a near zero cost. The investigative query under examination becomes
statistically relevant
86 because the invention provides statistical percentages to qualitative
claims, for instance, a 99.83%
87 probability exists that the industry could reduce emissions for a near
zero cost is inaccurate.
88 In addition to the foregoing attributes, the intelligent decision
support platform possesses the ability
89 to take transformed qualitative data and perform categorical, nominal,
ordinal, interval and ratio
90 analyses beyond conventional qualitative analyses which cannot perform
statistical analyses on
91 qualitative data beyond a rudimentary categorization. Conventional data
analyses on qualitative
92 information cannot assign numerics, percentages or ratio values to the
subjective material that this
CA 3025302 2018-11-26
4
93 invention has the functionality to perform, for instance by assigning
values for cost per incident,
94 total costs and weighted costs.
95 Similarly, 212 stand-alone analytical templates are available that offer
a wide-range of qualitative
96 assessments showing the tremendous flexibility of the invention's
utility. Automating the templates
97 will provide additional assessment coverage saving thousands of dollars
for the client by having
98 these analytic templates built into the invention as an advantageous
embodiment. In addition, each
99 template will remain evergreen with ongoing enhancements being built
modularly.
100 This invention has the unique capability to measure high risk targets
as defined by greater than 95%
101 potential risk exposure to create what-if scenarios. Results from the
what-if, scenario planning or
102 harmonic box plot can provide risk-informed data as input to back-up
plans and help control risks in
103 the workplace as a practical example of the invention's application.
104 Contingency planning is supported in the invention by an increased
awareness of what could go
105 wrong. For example, after data is entered and analyzed, the annual
control cost can better assist
106 decision makers to understand budget limitations and identify hidden
costs or potential benefits.
107 The invention's risk management plan, scorecard and analytical
attributes are original because of
108 the integration of quantified qualitative datasets. The benefits to
robust analytics can better manage
109 operations, for example, risk-informed decisions can result in process
improvements. Other benefits
110 include increased capacity to identify issues in capital budget
planning or reducing loss exposures.
111 The invention's specialty functions possess numerous benefits to the
client and can support risk
112 financing, risk allocation and risk control.
113 It can thus be seen that the present invention provides a novel process
that utilizes quantified
114 qualitative data integrated with analytics which successfully
incorporates seven separate service
115 platforms for analytical processing in a dashboard. The dashboard
contains unique functions and
116 interactions with respect to the quantified data, for instance it
returns graphical displays of the
117 advanced operations and statistical measures on important qualitative
information for decision
118 makers from one or more source documents. The final analysis results
are detailed in an intelligence
119 report that is delivered to the client.
CA 3025302 2018-11-26
5
120 Description of Prior Art
121 Known in the patent searches is that risk assessments, analytics and
methods are provided.
122 Similarly, decision analytics are known in the prior act. However, no
prior art exists for a process to
123 integrate quantified qualitative data into decision analytics. This
invention's process to integrate
124 quantified qualitative data into analytics is useful particularly to
the field of decision analytics. This
125 invention exceeds the utility of other analysis systems by combining
several knowledge bases into
126 the Intelligent Decision Support Platform including: Business
Intelligence (BI), Competitive
127 Intelligence (CI), Decision Support with Risk Management. The
inventiveness of this invention is
128 its ability to process quantified qualitative data as a measurable,
countable, numeric dataset.
129 Previously, those skilled in the art of data analytics or in the fields
of Business Intelligence,
130 Competitive Intelligence or Decision Support or Risk Management were
unable to incorporate this
131 type of detailed qualitative dataset as this invention does.
132 Risk Patent Searches: Patent CA2797487A1; Patent CA2830666A1; Patent
CN101236619A; Patent
133 CN101726761B; Patent CN101727627A; Patent CN102829331A; Patent
CN103425089A; Patent
134 CN103927604A; Patent EP0077239B1; Patent EP0916114B1; Patent
EP0916114B1; Patent
135 EP1987480A2; Patent EP2005293A2; Patent EP2104845A1; Patent
EP2564366A1; Patent
136 EP2633403A4; Patent EP2725352A1; Patent EP2725352A1; Patent U56210272;
Patent
137 U56210272; Patent U56334192; Patent U56334192; Patent U56381610; Patent
US6468155; Patent
138 U57130779; Patent U57467044; Patent US7467045; Patent US7533798; Patent
U57536405; Patent
139 U57593859; Patent U57693724; Patent U57698148; Patent U57707511; Patent
US7739141; Patent
140 U57752125; Patent U57769684; Patent U57774184; Patent US7783500; Patent
US7809634; Patent
141 U57831494; Patent U57873567; Patent U57930753; Patent U58000992; Patent
U58022831; Patent
142 US8036980; Patent U58050993; Patent U58121937; Patent U58209246; Patent
U58214235; Patent
143 US8249886; Patent U58510147; Patent US8621637; Patent US8650637; Patent
U58676721; Patent
144 U58686844; Patent US8805618; Patent U58831972; Patent US8854199; Patent
U58880422; Patent
145 US8892409; Patent U520020099586; Patent U520020138371; Patent
US20020165809; Patent
146 U52003 0065241; Patent US20030069821; Patent US 20030078869; Patent
U520040015376; Patent
147 US20040172317; Patent US20040215551; Patent US20050209897; Patent
US20060015253; Patent
148 U520060089861; Patent US20060106686; Patent U520060116898; Patent
US20060149604; Patent
149 U520060287947; Patent US20060916898; Patent US 20070015506; Patent
U520070078758; Patent
150 U520080154679; Patent U520080208637; Patent US20080228518; Patent
US20080255910; Patent
151 US20080282320; Patent U520090070170; Patent U520090222326; Patent
U520100042451; Patent
152 U520100257008; Patent U520110301043; Patent US20110308790; Patent
U520120116837; Patent
153 U520120303547; Patent U520130132275; Patent U520130197965; Patent
US20130310121; Patent
154 US20130332388; Patent US20140067636; Patent US20140074668; Patent
US20140088449; Patent
155 US20140136276; Patent U520140137257; Patent US20140304176; Patent
U520140337086; Patent
156 W02003 032008A2; Patent W02003034309A1; Patent W02007101129A2; Patent
157 W02008088636A1; Patent W02011139625A1; Patent W02011159919A2; Patent
158 W02012107933A1; Patent W02012146893A2; Patent W02012146894A2; Patent
159 W02013013257A1; Patent W02014160348A2.
CA 3025302 2018-11-26
6
160 Decision Support Searches: EP1987480A2; U5582624DA; US3598264A;
US5377095A;
161 U56029138; U56210571 B1; U56275818 B1 and 2391842.
162 It is evident that the prior art fails to teach, or even suggest, a
process to integrate business processes
163 for decision-making in a dashboard or use transformed qualitative
source data as quantified data
164 items and then utilize the quantified qualitative information in
advanced statistical operations and
165 statistical measures. Nor does prior art contain dashboard functions
with respect to the quantified
166 data for a decision point as Go/No-Go by the series data bisect,
utilization rate or the bias
167 computation. Nor does prior art use a dashboard to support further
analyses by means of sample
168 scheme drill-down, advanced statistical operations or hypotheses tests.
Nor does prior art return
169 statistical results of each qualitative dataset that was tested
applying a bias computation or by way
170 of a sample scheme drill-down or in a hypothesis tests by means of
statistical measures that return
171 numeric values in the dashboard graphic displays. Furthermore, it is
evident that the prior art fails to
172 teach, or event suggest an integration of at least four separate
platforms into the process with
173 information collected pertaining to business intelligence, competitive
intelligence, decision support
174 or risk management to return meaningful statistical analyses on
quantified qualitative data.
175 In research, the Likert Scale exists.
176 This invention is above the state of the art because it utilizes a
quantified qualitative dataset that was
177 tested and found to be more reliable than the Likert Scale which
previously translated opinions into
178 numerical data but was expressed in relative agreement statements,
which meant that the Likert
179 Scale (UK Media Research. (June 2, 2010). FAQ 33: How do I bring
qualitative and quantitative
180 data together? Accessed January 13, 2018, from
181
www.lse.ac.uk/media@lse/research/EUKidsOnline/BestPracticeGuide/FAQ33.aspx)
also inherited
182 the subjectivity of human error. Instead, this invention's valuable
discovery relies on a standardized
183 dataset and an internal process that transforms the source
documentation, such that measuring the
184 primary document is consistent and repeatable.
185 Author Horst Treiblmaier , (Department of International Management,
MODUL University Vienna,
186 Vienna, Austria) research paper on "The impact of the blockchain on the
supply chain: a theory-
187 based research framework and a call for action" was accepted on August
7, 2018, where he claims
188 that "no academic papers are published in leading academic journals
that investigate the
189 relationship between SCM and blockchain from a theory-based
perspective" ... "presenting a
190 framework built on four established economic theories, namely,
principal agent theory (PAT),
CA 3025302 2018-11-26
7
191 transaction cost analysis (TCA), resource-based view (RBV) and network
theory (NT)"; thus, it is
192 apparent from the foregoing that the prior art fails to teach, or even
suggest the advanced levels of
193 measurement which include the nominal, ordinal, interval or ratio
levels of measurement are used
194 for qualitative analytics. In contrast, this invention's inventiveness
utilizes advanced levels of
195 measurement which are the nominal, ordinal, interval or ratio to
measure and return statistically
196 significant results on the quantified qualitative data. Additionally,
it is apparent that the prior art
197 fails to provide as solid a framework structure as is present in the
intelligent decision support
198 platform.
199 The invention's Library Dataset was built on 280 proven frameworks,
principles and laws which
200 included but was not limited to: algebra, codes, common knowledge,
ethics, geometry, human
201 condition, laws, levels of measurement, metrics, logic, models,
numbers, philosophy, properties,
202 rules, standards, statutory accounting principles, strategies and
theoretical principles. The
203 invention's Library Dataset of 22,600 data items is incorporated by
reference into the specification
204 of this application. Presently the data items are in English with
future translations planned. As part
205 of the process to integrate quantified qualitative data into analytics,
the Library Dataset restricts
206 duplication of definitions such that only one definition is assigned to
a data item. When two
207 different definitions are applicable, then the rule applied is to
differentiate the data items by (n) or
208 (v) designations which are then processed as to their correct context.
The Library Dataset is the first
209 dataset of quantified qualitative data. The Library Dataset utility is
a mechanism to reduce
210 miscommunication as all data items are set with the same meaning for
every analysis. This is an
211 advantageous embodiment to clarifying statements and as such is a tool
used for effective
212 communication. The Delphi Questionnaire is a conventional communication
technique which relies
213 on a panel of experts. The problem with the Delphi Questionnaire is its
reliance on consensus.
214 Changing the focus of the experts to the source document which is part
of the invention's process to
215 integrate quantified qualitative data into analytics, the invention's
new approach for using Delphi
216 Questionnaires circles the meanings and definitions back via a
communication loop in the Library
217 Dataset. Therefore, the reliance on consensus or personal opinion is
removed because the defined
218 meaning is utilized instead, thus increasing the effectiveness of the
communication.
219 List of the 280 frameworks, principles and laws follows,
220 Acceptance and Commitment Therapy; Activity Based Budgeting;
Adversarial Risk Analysis;
221 Affirmative Principle; Anthropogenic Global Warming Theory; APEGA
Practice Standards,
222 Applied Behavior Analysis; Applied Science; Attributive Value Theory;
Backward Chaining;
CA 3025302 2018-11-26
8
223 Bankruptcy; Basic Principles of Effective Communication; Basic
Principles of the Rule of Law;
224 Behavior Modeling; Behavioral Economics; Behavioral Science; Belonging
to; Benefits
225 Segmentation; Beta Decay; Bible, 1 Timothy 4:8; 2 Peter 1: 3-5; 2 Peter
1: 6,7; Biological Agents;
226 Biometric Authentication; Blackman's Law of Limiting Factors; Boolean
Algebra; Business
227 Continuity; Business Ethics; Business Level Strategy; Business Style of
Motivation; Canada Salary
228 and Pay Scale; Canadian Government's Hospitality Policy; Causal
Analysis; Caux Round Table
229 Principles; Certified Systems; Challenge-Response Theory; Change
Management; Chaos Theory;
230 Civil Code; Client Centric Approach; Closing; Coherence; Collision
Theory; Common Knowledge;
231 Communication Theory; Comparative Negligence; Complexity Theory;
Contract Theory;
232 Contradictive; Contingency Theory; Core Beliefs; Corporate Credo; Cost
Competitiveness; Create
233 Social Media Images; Credit Risk Assessment; Crime Prevention Through
Environmental Design
234 (CPTED); Cross-Cutting Relationship; Crossfire Challenge; Cytology;
Danger Model; Darwinism;
235 Data Analysis; Data Democratization; Decision Making; Decision Theory;
Default Risk;
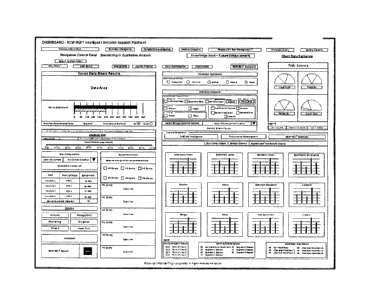
236 Democratic Deficit; Democratic Rights; Deviating; Diagnostic
Assessment; Discrete Number Rule;
237 Dispositional Optimism; Dundee Law; Early Warning System; Ecological
Pyramid; Emotional
238 Intelligence (EQ); Endangered; Ethnicity Classification Canada; Ethnic
Origin; Even-handed
239 Dealing; Exposure Therapy; Externalization; Evolution; Fair Information
Practice Principles;
240 Fictitious Narration; Fidelity; Financial Reporting; Financial
Responsibility Law; First Fundamental
241 Principle; First-Order Logic; Five Key Principles of Corporate
Performance Management; Fossil
242 Succession & Index Fossils; Front-End Planning; Fundamental Principle
of Ethics, Fundamental
243 Science; Self-rule; Future State; Game Theory; Garbage Can Model;
Gardening; Gender;
244 Geographic-Based Divisions; Generally Accepted Accounting Principles;
Goal Theory; Godel's
245 Incompleteness Theorems; Hard Controls; Heaviest; Hierarchy of
Competence; Hierarchy of
246 Hazard Controls; Hierarchy of Laws; Human Condition; Human Motivation
Theory; Imbue;
247 Inductive Learning; Informs; Integrated Production Technologies;
Intellectual Science; International
248 Ongoing Disclosure Standards or IODS; International Union for
Conservation of Nature (IUCN);
249 Interpersonal Communication; Judgmental Variables; Jurisprudence and
Legal Theory; KISS
250 Principle; Labor Theory of Property; Labor Theory of Value; Law of
Attraction; Law of Effect;
251 Law of Large Numbers; Law of Transference; Legal Issues; Legislative
Advocacy; Let the Polluter
252 Pay; Level of Measurement; Management Theory; Linguistics; Marginal
Principle of Retained
253 Earnings; Maturational Theory; Marketing Mix 4Ps to 7Ps; Matching
Principle; Mathematical
254 Model; Mechanical Failure; Mental Discipline Theory; Metric Prefixes;
Mood Congruence; Moral
255 Philosophy; Multicolumn Training Format; Non-GAAP Earnings; Occasion
Segmentation; Open
256 Rate; Ordinal Number; Organizational Behavior (OB); Organization
Theory; Outcomes Theory;
257 Ownership Interest; Paedomorphocline; Passenger; Pay Scale; Percent
Decrease; Phenomena of
258 Chemistry; Philosophy of Data; Popular Food; Power Projection; Practice
of Professional
259 Engineering; Precautionary Principle; Principle of Arc in Animation;
Principle of Exception;
260 Principles of Chaos, The Butterfly Effect; Principles of Chaos,
Feedback; Principles of Chaos,
261 Fractals; Principles of Chaos, Mixing; Principles of Chaos,
Unpredictability; Principle of Cross
262 Cutting Relationships; Principle of Drag; Principle of Faunal and
Floral Succession; Principle of
263 Lateral Continuity; Principles of Delegation of Authority; Principles
of Fraud Examination;
264 Principles of Fringe Benefits; Principles of Fundamental Justice;
Principles of Good Customer
265 Service; Principles of Internal Control; Principles of Marketing;
Principles of New Business
266 Intelligence; Principles for Ongoing Disclosure; Principles of Social
Equality; Process Theory;
267 Project Impact Assessment; Project Management Theory; Properties of
Equality in Geometry;
268 Psychometric Verbal Reasoning Test; PUWER 1998 Regulation; Quality
Management Principles;
269 Quantity Theory of Money; Race; Recovery Objectives; Regret (Decision
Theory); Regulation ISO
270 9001:2015; Regulation ISO 31000:2018; Regulations; Regulative;
Reliability Theory; Reputation;
271 Reputation Management; Risk Assessment and Treatment; Risk-Based
Auditing; Risk Management
CA 3025302 2018-11-26
9
272 Standard; Risk-Return Trade-off; Scientifically, Hard Measurements;
Scoring Principle; Social-
273 Emotional Development; Safety Margins, Sanctioning; Science; Scientific
Management;
274 Segmentation; Seismic Design Principles; Showcased; SI System; Simple
Intellect; Social
275 Exchange Theory; Soft Controls; Solution-focused Therapy; Stage-Gate
Steps and Metrics for R&D
276 in a Traditional Advanced Materials Chemical Industry; Stakeholder
Theory; Start-to-Finish
277 Dependency; Statutory Accounting Principles; Steno's Law; Systems
Theory; Subjective Territorial
278 Principle; Suffering; Tactical Leadership Skill; Technique of
Operations Review; The Extremal
279 Principle; The Benefit Principle; The Business Cycle; The Oil Industry;
The Principle of
280 Anticipation; The Principle of Appeal; The Principle of Exaggeration;
The Principle of Follow
281 Through; The Principle of Good Faith; The Principle of Overlapping
Action; The Principle of Pose
282 to Pose; The Principle of Secondary Action; The Principle of Solid
Drawing; The Principle of Slow
283 In and Slow Out; The Principle of Squash and Stretch; The Principle of
Staging; The Principle of
284 Straight Ahead Action; The Principle of Timing; The Principle of Twins;
The Project Management
285 Life Cycle; Theoretical Probability; Theory of Art; Theory of
Constraints; Theory of Work
286 Adjustment (TWA); Theory of Change (ToC); Theory X and Theory Y; Time
Dilation; Time Spans
287 in Geochronology. The Present is the Key to the Past; To Know; To
Remember; Train the Trainer;
288 Training Objectives; Triceratops; Tuckman's Teamwork Theory; Ulterior
Motive;
289 Uniformitarianism; United States of America; Unity-of-Command
Principle; Unprincipled;
290 Unprincipled Conduct; Unresolved Law; Vortex; Water Resources Law; Web
Mining; Weeklong;
291 Youth Culture, and; Zones.
292 It is apparent from the foregoing that the prior art fails to teach, or
even suggest, a process to
293 integrate quantified qualitative data into analytics in a system is a
significant shortfall. In contrast,
294 the invention as disclosed is an Intelligent Decision Support Platform
capable of integrating
295 quantified qualitative data into business intelligence, competitive
intelligence, decision support, risk
296 management, what-if analysis, stand-alone analysis or an integrated
package. It is also apparent
297 from the foregoing prior art that the invention as an Intelligent
Decision Support Platform
298 incorporates a multitude of frameworks, principles and laws as a
science-based process where no
299 prior art gives an exact description.
CA 3025302 2018-11-26
10
300 SUMMARY OF THE INVENTION
301 The invention pertains to a process to integrate quantified qualitative
data into analytics utilizing an
302 Intelligent Decision Support Platform.
303 On December 12, 2013 the invention's concept was initiated and
subsequent research into analytics
304 resulted in the continuation of tests into the quantification of
qualitative data culminating in two
305 successful demo trials on November 5th and 9th, 2018. Star-Ting
Incorporated published its findings
306 that demonstrated the value of quantified qualitative data in an
intelligence report on November 8,
307 2018, "Methane Reductions Intelligence Report" of the TP-0001E Methane
Emissions Case Study.
308 This report authored by Loreen Sherman and Wayne Olson has the ISBN 978-
0-9916942-1-1 and is
309 incorporated by reference into the specification of this application.
310 The structural uniqueness of the system is the integration of
quantified data into a plurality of
311 business processes for decision-making using a dashboard to present
source data, organize data,
312 perform advanced operations and applying statistical measures to the
quantified qualitative data.
313 Then, using the results generated from categorical, nominal, ordinal,
interval and ratio analytics to
314 provide meaningful information for a user to write an intelligent
report with meaningful results that
315 is delivered to the client.
A
316 The invention is flexible because seven different platforms are built
into its design with future
317 enhancements identified. The invention is practical because it
functions as a stand-alone unit or as a
318 system with many parts. Each part is selected by the client when
choosing the scope of the
319 investigation. For example, when competitive intelligence has been
selected as the analysis type and
320 an annual report as the type of document for the investigation, then
the linkage to the workflow
321 follows these steps: entering source data, completing journal register,
statistical processing, and in
322 some cases entering monitoring and / or mitigation strategies as the
client chooses the required
323 coverage detailed in the worksheets.
324 One aspect of the intelligent decision support platform is a dashboard
with activated buttons and
325 drop-down menus for user interaction. The dashboard allows multiple
ways to solve the client's
326 issue(s). The dashboard provides navigation controls for each separate
platform or combination of
327 platforms as a robust and intelligent decision support platform. The
invention's dashboard's layout
328 is flexible, for instance one aspect includes segmenting the dashboard
into the navigation control
329 panel, the series data bisect/utilization rate, advanced
operations/statistical measures, client data
CA 3025302 2018-11-26
11
330 exchange/risk scores, bias computations/hypotheses/controls, and test
results display/future
331 enhancements.
332 One aspect of the dashboard is the structural uniqueness of the
Navigation Control Panel which
333 contains version information, all seven platforms for the user to
select as separate or integrated
334 services: business intelligence, competitive intelligence, decision
support, responsible risk
335 management (Registration Number TMA952,719 File Number 1752883), what-
if analysis, stand-
336 alone analysis and integrated analysis from combining platforms. Each
of the seven platforms is a
337 variation of the quantified qualitative analytics using statistical
processing.
338 One aspect of the dashboard is the structural uniqueness of the Series
Data Bisect which generates a
339 mid-point value and the invention graphically displays the results, for
example, 601 divided by 2
340 rounded is 300. The Series Data Bisect result shows the mid-point data
value on a graphic display
341 that corresponds to the data area. The Series Data Bisect provides a
visual inspection that the source
342 data was correctly entered and is a control check.
343 One aspect of the dashboard is the structural uniqueness of the
utilization rate which relies on a pre-
344 defined rule where a minimum hurdle of 85% is required to proceed with
the investigation. The
345 utilization rate of at least 85% of the source document's data content
is required to proceed with the
346 investigation of the Bias Computation; Sample Scheme Drill Down,
Hypotheses Tests and/or
347 extended analytical tests and processes. Implemented into the design-
build of the intelligent
348 decision support platform prototype is a Critical Mass Rule that states
when the utilization rate is
349 95% or greater, then additional testing of the transformation process
is unnecessary.
350 One aspect of the dashboard is the structural uniqueness with three
decision points integrated into
351 the dashboard functionality, which are the series data bisect,
utilization rate and the bias
352 computations. A Go / No-Go decision is made by the client based on the
three decision points'
353 results to assure data integrity, consistency, repeatability and valid
representative analytical results.
354 The dashboard's unique set of controls build confidence in the system's
utility and functionality to
355 perform statistical operations on quantified qualitative information.
At this point in the invention,
356 the client makes the Go / No-Go decision to continue the analysis of
the source documentation
357 under investigation. These controls are unique and are not available in
other models, systems or
358 technologies and as such, this invention is the first in the world to
place controls on the process to
359 quantify qualitative datasets.
CA 3025302 2018-11-26
12
360 One aspect of the invention's dashboard is the structural flexibility
of the system's generated
361 analytics. Graphic displays visually show results from the advanced
operations and associated
362 statistical measures for the Bias Computation, Sample Scheme and / or
Hypotheses Tests
363 individually or for combined results. No prior integration of the Bias
Computation with the Sample
364 Scheme and with correlation to the Hypotheses Tests exist, such that
integrating these three as part
365 of the process is unique and the first in the world. The statistical
processing of information displays
366 one result of the Bias Computation, one result of the Sample Scheme
drill-down and up to six of the
367 Hypotheses Tests on one screen as a collective. The flexibility of the
invention's dashboard to
368 display statistical results in multiple analytics is an advantageous
embodiment of the intelligent
369 decision support platform's functionality.
370 One aspect of the invention's dashboard is the RESP-ROI (Registration
Number TMA948,326 File
371 Number 1752882) Scorecard which provides an overview of the various
steps available for a
372 client's selection to complete an enterprise risk assessment, manage,
monitor, mitigate and report on
373 the client's risk. The intelligent decision support platform is
flexible in its interchangeability of
374 sequencing, for example source data is entered, and project information
is captured in the journal
375 register but afterwards the client has multiple options. When a client
selects the issue identification
376 button or the classification button it activates worksheets with
additional required information
377 identified and a fillable form to fulfill an assessment. Sequential
steps in the invention are not
378 always predetermined, thus, allowing the client to create a fit-for-
purpose solution.
379 The invention can be adapted to multiple purposes. The invention's
useful scorecard integrates
380 multiple management functions including advisory, decision support and
assessment services in the
381 fields of business communication, business development, business
ethics, business management,
382 business governance, business strategy, business planning, capital
investment analysis, change
383 management, compliance, consulting, contract life cycle management,
corporate governance, crisis
384 management, educational and professional development, energy
management, engineering
385 management, enterprise resource planning, financial management, fleet
planning, geological data
386 management, human resources management, information governance,
interpersonal communication
387 in a business context, knowledge management, knowledge and skills
management, leadership
388 performance, lean enterprise, liability exposure, marketing strategy,
national, international and
389 industry process standards, negotiations, operations management,
marketing and sales,
390 organizational behavior, organizational effectiveness, performance
management, process quality
391 assurance, process safety risk, procurement, risk management,
responsible corporate citizenship,
CA 3025302 2018-11-26
13
392 scientific management, strategic planning, succession planning, and
supply chain management. This
393 disclosure illustrates the flexibility in the invention's analytics as
the investigation relates to both
394 data and decisions or decision analytics similarly. The scorecard is
flexible with high utility for
395 business intelligence, competitive intelligence, decision support
and/or risk management; and more
396 specifically to a method of quantifying qualitative data by using
advanced operations and/or
397 statistical measures.
398 One aspect of the invention's dashboard is the structural uniqueness of
the Client Data Exchange
399 Portal where the client places their source documents for analytical
processing. The Client Data
400 Exchange Portal is also used to communicate documentation back to the
client throughout the
401 analytical processing sequence as may be necessary from time-to-time.
These communications can
402 include general information to better perform the preliminary problem
diagnosis. Subjective
403 information is qualitative and exists in multiple formats; the list is
extensive and includes but is not
404 limited to: articles, blogs, Annual Reports, Annual Information Forms,
Management and Discussion
405 Analysis, Intelligence Reports, Stock Sector Communications and other
types of documents where
406 written information is exchanged. Information about who or how the
initial contact was made, the
407 identified issue(s) or information about the scope of the overview
analysis is also exchanged via the
408 Client Data Exchange Portal. Alternatively, issues identification with
respect to accountability and
409 responsibility or client expectations may be exchanged. Another utility
for the Client Data
410 Exchange Portal is transfer of the design requirements or
clarifications to the scope and magnitude
411 of the project in respect to the seven platforms within the invention.
For example, a practical use of
412 the invention, the client's engineering department may have no clear
preference about the type of
413 analysis required to complete before the sanctioning of a project or
construction start. Many factors
414 affect a project's performance from insufficient or incomplete front-
end planning such that the
415 Client Data Exchange Portal is an advantageous embodiment in the
invention that increases the
416 timeliness, efficiency and effectiveness of communication as well as
reducing inaccurate or
417 inappropriate estimates or targets. Scope creep can be greatly reduced
because of the invention's
418 interface features within the Client Data Exchange Portal enabling the
client to better handle
419 document management with the service provider, Star-Ting Incorporated.
420 One aspect of the invention's dashboard is the structural uniqueness of
the Advanced Operations
421 and/or Statistical Measures. The invention's advanced operations
include: categorical, nominal,
422 ordinal, interval and ratio calculations. The invention's statistical
measures include: arithmetic
423 mean, geometric mean, harmonic mean, coefficient of variance, median,
mode, range, skew,
CA 3025302 2018-11-26
14
424 standard deviation, standard error variance, and Z-Score. Conventional
statistical functions return
425 the same results in the invention's quantified qualitative analyses.
426 The invention's statistical results are meaningful, repeatable and are
of value to the client. For
427 example, the RESP-ROI (Registration Number TMA948,326 File Number
1752882) system
428 generated a statistical measure of 49.31%; a weak support level,
therefore, the likelihood the claim
429 made by Environment Canada that its proposed rules would cost about
$3.3 billion over 18 years as
430 estimated may or may not be accurate. Statistical results on
qualitative information generated from
431 the process built into the Intelligent Decision Support Platform to
integrate quantified qualitative
432 data into analytics is the first in the world.
433 One aspect of the invention's dashboard is the structural uniqueness of
the Risk Scores which return
434 four different ratings on the qualitative data as magnitude, precision,
reliability and worst case. The
435 uniqueness of the invention's technical functions is the ability to put
numbers on subjective and/or
436 qualitative material and/or narrative information.
437 One aspect of the invention's dashboard is the structural uniqueness of
the Hypotheses Tests which
438 take queries in a question relative to the source document contents and
returns significantly
439 statistical results as counts, numbers and units of measure that can be
compared on a ranked or
440 proportional or percentage basis.
441 One aspect of the invention's dashboard is the structural uniqueness
includes steps for an audit trail
442 documenting the client's selected investigation from the point of
authorization to the end of the
443 analysis process.
444 One aspect of the invention's dashboard is the structural uniqueness of
the Test Results Display
445 which returns three separate sets of statistical tests, one set from
the Bias Computation, the second
446 set from the Sample Scheme Drill Down; and the third set from the
Hypotheses Tests. Each of the
447 investigations are run solely on the narrative material contained
within the source document(s).
448 These documents are subjective and/or qualitative in content and
substance. These statistical
449 operations and measures return meaningful and significant results. For
example, utilizing the
450 Intelligent Decision Support Platform on the HO Query: Should this
statement be accepted as
451 reasonable that Industry can reduce emissions of a powerful greenhouse
gas at a near zero cost? It
452 was found, the Academic Study claimed that Industry can reduce
emissions of a powerful
453 greenhouse gas at a near zero cost. This claim was analyzed under the
RESP-ROI (Registration
CA 3025302 2018-11-26
15
454 Number TMA948,326 File Number 1752882) methodology and was found there
is only 0.07%
455 likelihood that this claim made by the Academic study is realistic for
Industry to reduce emissions
456 of a powerful greenhouse gas for a near zero cost. Additionally, it was
found that in all the queries
457 under investigation, the outcomes found academic study's point that
industry could reduce
458 emissions "at a near zero cost" was the worst case in providing
supporting evidence in this press
459 release to substantiate the claim. Moreover, there is 99.93%
probability that the target to reduce
460 emissions for a near zero cost is inaccurate. In fact, the argument
that early methane reductions
461 would be zero cost to Industry was not supported; and can be rejected
outright.
462 In the drawings, which form a part of this specification,
463 Fig. 1 is a diagrammatic view of the invention's dashboard in a
preferred embodiment of the
464 invention, showing the layout of the Intelligent Decision Support
Platform;
465 Fig. 2 is the layout of the invention's dashboard visual display on a
computer with parts identified
466 for clarity of illustration, showing the dashboard layout of the
Intelligent Decision Support Platform.
467 (The future enhancement of increased functionality in a cloud-based
technology would include
468 accessibility via mobile devices);
469 Fig. 3 is a segmented view of the Intelligent Decision Support
Platform's dashboard with sections
470 A-F for clarity of illustration of the components and accessibility of
built-in button functions and
471 features;
472 Fig. 4 is a semi-diagrammatic view of the invention's navigation
control panel according to one
473 embodiment of the invention, showing the version information and quick
access menus for the
474 client;
475 Fig. 5 is an enlarged diagrammatic view of an advantageous embodiment
of the invention's series
476 data bisect display; and another advantageous embodiment of the
invention's utilization rate display
477 where both results are displayed visually for clarity of illustration;
478 Fig. 6 is an enlarged diagrammatic view of the invention's selections
for the particular embodiment
479 of the advanced operations and statistical measures of the dashboard
for clarity of illustration;
480 Fig. 7 is an enlarged diagrammatic view of the invention's client data
exchange hyperlink showing a
481 particular embodiment of the invention's analyses library button, the
library dataset button; and one
482 embodiment of the risk scores on the dashboard for clarity of
illustration;
CA 3025302 2018-11-26
16
483 Fig. 8 is an enlarged diagrammatic view of the invention's structurally
unique functions integrated
484 into several business processes; and the preferred embodiment of the
bias computation with a
485 Go/No-Go decision point. The view also shows the preferred embodiment
of the hypotheses tests,
486 audit trail and validation that culminates in an intelligence report
for clarity of illustration;
487 Fig. 9 is a top plan view of the invention's dashboard displays that
show the bias computation
488 results, sample scheme drill-down results as well as the hypotheses
test results in a graphical display
489 for clarity of illustration. Three future enhancements are visible to
show scale and growth potential
490 including a button that activates a worksheet on Artificial
Intelligence (Al); another button for
491 professional development and the third button for specialized materials
for extended analytics;
492 Fig.10 is a diagrammatic view of the invention's interrelationship of
the linkage of each
493 navigational feature as buttons or hyperlinks on the invention's
dashboard showing the connectivity
494 of interactions to and from worksheets;
495 Fig 11 is a workflow process map showing the process steps of the
invention's quantified qualitative
496 analytical process starting with client data and ending with the
delivery of an intelligence report
497 which results in the company sending an invoice for final payment;
498 Fig 12 is an enlarged diagrammatic of the invention's Harmonic
Boxplot's showing the interquartile
499 range and outliers for clarity of illustration;
500 Fig 13 is an enlarged diagrammatic of the invention's Rank Chart's
showing the test results for tests
501 and displays bar charts for clarity of illustration of the bias
computation, sample scheme and
502 hypotheses tests;
503 Fig 14 is the invention's Analyses Library catalogue of 212 stand-alone
analytics listed with
504 reference 1D's for clarity of illustration;
505 Fig 15 is the invention's worksheet for selecting a list of suggested
documents suitable to run
506 analytics on the Business Intelligence platform for clarity of
illustration;
507 Fig 16 is similar to Fig 15, of the invention's worksheet for selecting
a list of suggested documents
508 suitable to run analytics on the Competitive Intelligence platform for
clarity of illustration;
509 Fig 17 is similar to Fig 15 or Fig 16, of the invention's worksheet for
selecting a list of suggested
510 documents suitable to run analytics on the Decision Support platform
for clarity of illustration;
CA 3025302 2018-11-26
17
511 Fig 18 is a semi-diagrammatic view of one embodiment of the invention
showing the scorecard
512 listing the main components of the Intelligent Decision Support
Platform that shows the steps to
513 perform quantified qualitative analytics across the business for
clarity of illustration;
514 Fig 18A is an extension of Fig 18 to detail the components of the
invention's Journal Register
515 section for clarity of illustration;
516 Fig 18B is an extension of Fig 18 to detail the components of the
invention's Issue Identification
517 section for clarity of illustration;
518 Fig 18C is an extension of Fig 18 to detail the components of the
invention's Classification section
519 for clarity of illustration;
520 Fig 18D is an extension of Fig 18 to detail the components of the
invention's Analyses section for
521 clarity of illustration;
522 Fig 18E is an extension of Fig 18 to detail the components of the
invention's Controls section for
523 clarity of illustration;
524 Fig 18F is an extension of Fig 18 to detail the components of one
embodiment, the invention's
525 Responsible Risk Management (Trademark Registration Number TMA952,719)
section for clarity
526 of illustration;
527 Fig 18G is an extension of Fig 18 to detail the components of the
invention's What-If section for
528 clarity of illustration;
529 Fig 18H is an extension of Fig 18 to detail the components of the
invention's Mitigation section for
530 clarity of illustration;
531 Fig 181 is an extension of Fig 18 to detail the components of the
invention's Monitoring section for
532 clarity of illustration;
533 Fig 18J is an extension of Fig 18 to detail the preferred embodiment
components of the invention's
534 RESP-ROI (Trademark Registration Number TMA948,326) Reports section for
clarity of
535 illustration;
536 Fig 18K is an extension of Fig 18 to detail the components of the
invention's Scales used in all
537 statistical operations and measures for clarity of illustration;
CA 3025302 2018-11-26
18
538 Fig 19 is a diagrammatic of the invention's Management worksheet
illustrating a modification to
539 Fig. 15 detailing the invention's integration of business units with
leadership and governance for
540 clarity of illustration. The flexibility of the invention's Management
worksheet illustrates another
541 modification to Fig. 18F detailing the invention's risk management
program as an enterprise risk
542 process that alternatively can be modified for specific management
functional departments, business
543 units or areas of specialization for instance, business, leadership or
governance;
544 Fig 20 is a diagrammatic of an advantageous embodiment the invention's
Audit Trail worksheet for
545 clarity of illustration;
546 Fig 21 is a diagrammatic of the invention's RESPONSIBLE ROI (Trademark
Registration Number
547 TMA948,325) worksheet showing specialty calculations and the structural
uniqueness of the
548 triangulation risk score with some parts showing future enhancements
for clarity of illustration;
549 Fig 22 is a diagrammatic of the invention's Knowledge Bank worksheet
with some parts showing
550 future enhancements for clarity of illustration;
551 Fig 23 is a diagrammatic of the invention's Artificial Intelligence
(Al) worksheet with some parts
552 showing future enhancements for clarity of illustration;
553 Fig 24 is a diagrammatic of the invention's Professional Development
worksheet showing modular
554 courses, client support and training with some parts showing future
enhancements for clarity of
555 illustration; and
556 Fig 25 shows a photograph of the source document which in this case was
a press release as one
557 example of the various qualitative articles or narrations that can be
analyzed using the invention's
558 specialized qualitative analysis. Utilizing the invention's novel
methodology of statistical
559 processing the quantified qualitative datasets on the press release
resulted in the publication of the
560 findings in an intelligence report on November 8, 2018, "Methane
Reductions Intelligence Report"
561 of the TP-0001E Methane Emissions Case Study. This report authored by
Loreen Sherman and
562 Wayne Olson has the ISBN 978-0-9916942-1-1 and is incorporated by
reference into the
563 specification of this application.
564 DESCRIPTION OF THE PREFERRED EMBODIMENT
565 This application is a Canadian Patent Application filed November 24,
2018, titled PROCESS TO
566 INTEGRATE QUANTIFIED QUALITATIVE DATA INTO ANALYTI CS.
CA 3025302 2018-11-26
19
567 Keywords: `Analytics, Process, Qualitative Data, Business Process,
Steps, Intelligent Decision,
568 Support, Platform, Integrate, Quantified Data, Business Intelligence,
Competitive Intelligence,
569 Decision Support, Risk Management, Advanced, Statistical Operations,
System, Visual Displays'.
570 Written in the Visual Basic for Application (VBA) are code credits for
the Engineer: Wayne Olson,
571 Chief Engineer; Security Officer: Paul Sherman, Chief Operations
Manager; and the Business
572 Process Specialist / Creator: Loreen Sherman, Director & CEO, all at
Star-Ting Incorporated.
573 The "preferred embodiment" of the invention is to provide support for
decisions to be made relying
574 upon subjective documents, materials or reports with narrative
commentary used by boards,
575 academia, associations, C-suite, ENG0s, government, heads of state,
industry and organizations for
576 business intelligence, competitive intelligence, decision support and /
or risk management in the
577 invention which is an Intelligent Decision Support Platform. This
invention is the first to utilize
578 quantified qualitative datasets in its analytics for consistent,
repeatable statistically significant
579 results.
580 A full understanding will be obtained from the detailed description
presented hereinbelow, and the
581 accompanying drawings which are given by way of illustration only and
are not intended to be
582 limitative to any extent; and wherein:
583 With reference to the drawings and, in particular, with reference to
FIG 1, the invention is shown as
584 a dashboard in plan view of the RESP-ROI (Trademark Registration Number
TMA948,326)
585 Intelligent Decision Support Platform. The invention's dashboard
provides an at-a-glance view of
586 key results/metrics relevant to the objective of a quantified
qualitative analysis comprising of the
587 specialized business process of integrating business intelligence,
competitive intelligence, decision
588 support and/or risk management worksheets. By clicking on various
dashboard buttons, radio
589 buttons, check boxes and/or dropdowns the results and the queries
analyzed can be explored and
590 presented for multiple types of analytics. Zooming is one way the
client can access the displays.
591 Graphical filtering is used to allow the client to explore data by
clicking on active graphical
592 elements of the invention's dashboard. Several drill-downs add ease-of-
use such as: control-based,
593 filtered and hyperlink drill-downs. Drop-down menus are used to access
investigative queries as an
594 advantageous way to read the information under investigation for any
analysis. The layout of the
595 invention is displayed as a dashboard in a centralized and organized
platform to collect, identify and
596 organize the information utilized in the process to integrate
quantified qualitative data into analytics.
CA 3025302 2018-11-26
20
597 According to another aspect of the present invention includes a method
for displaying the
598 qualitative data in an intelligence display: client calibration, risk
ratings and benchmark and
599 sampling scheme data, each are displayed embodying a program that
identifies the series data bisect
600 and utilization rate.
601 According to another aspect of the present invention includes a method
for displaying the
602 qualitative data into an display of risk ratings: the outputs are the
results of best-case which is
603 associated with risk averse; neutral-case which is associated with risk
neutral; and worst-case
604 scenarios which is associated with risk seeker.
605 According to another aspect of the present invention includes a method
for synthesizing qualitative
606 data including workflow: a program to select menu options including:
context, identification,
607 analysis, mitigation and monitoring.
608 According to another aspect of the present invention includes a method
for synthesizing qualitative
609 data including activity stream: a program to select advanced operations
including: nominal, ordinal,
610 interval and ratio.
611 According to another aspect of the present invention includes a method
for synthesizing qualitative
612 data including comparative: a program to select menu options including:
control data set, sampling
613 scheme, Ho, Hi, H2, H3, 114 and H5.
614 According to another aspect of the present invention includes
synthesizing the quantified qualitative
615 data into report form as exemplified by the published intelligence
report by Star-Ting Incorporated
616 on November 8, 2018, "Methane Reductions Intelligence Report" of the TP-
0001E Methane
617 Emissions Case Study. This report authored by Loreen Sherman and Wayne
Olson has the ISBN
618 978-0-9916942-1-1 and is incorporated by reference into the
specification of this application.
619 According to another aspect of the present invention includes a program
storage device with
620 programming for implementing the steps of synthesizing data, analytics,
reporting and validation of
621 the qualitative data inputs into the transformation step of data
outputs; associating, classifying and
622 prioritizing risks; applying risk scores; displaying the report; and
confirming validations over time.
623 According to another aspect of the present invention includes a system
for implementing the data
624 capture fields: user selection, intelligence display, risk ratings,
workflow, activity stream,
625 comparative measures, statistical measures and report.
CA 3025302 2018-11-26
21
626 According to another aspect of the present invention includes a system
for displaying the statistical
627 data in column cluster bar charts associated to three different
analyses: bias computation, sample
628 scheme and hypotheses test. 12 statistical measures are displayed for
all three: arithmetic mean,
629 geometric mean, harmonic mean, coefficient of variance, median, mode,
standard deviation,
630 variance, range, skew, standard error and Z-score.
631 One aspect of the invention displays the Queries with drop-down menus.
For example, the Bias
632 Computation and the Sample Scheme query are selected by choosing the
drop-down field from
633 "Select Bias Context" or "Select Sample Scheme Context", while the HO
query is selected by
634 clicking on the HO Query checkbox.
635 One aspect of the invention displays Risk Scores associated with the
statistical outputs as
636 magnitude, precision, reliability and as worst case. Each score is sub-
divided into three categories:
637 low as risk averse, moderate as risk neutral and high as risk seeker.
638 According to another aspect of the present invention includes a system
for displaying the data
639 capture fields: context, identification, analysis, mitigation and
monitoring for business intelligence,
640 competitive intelligence, decision support and RESPONSIBLE RISK
MANAGEMENT
641 (Registration Number TMA952,719 File Number 1752883).
642 According to another aspect of the present invention includes a system
for displaying the data
643 capture fields: activity stream, comparative measures, statistical
measures, report and validation for
644 business intelligence, competitive intelligence, decision support and
RESPONSIBLE RISK
645 MANAGEMENT (Registration Number TMA952,719 File Number 1752883).
646 According to another aspect of the present invention involves a general
coded application adapted to
647 manage the user selection, workflow activities, comparative analytics,
statistical measures, the
648 report display, the intelligence display with future database in the
background.
649 Further scope of applicability will become apparent from the detailed
description presented
650 hereinafter. It should be understood, however, that the detailed
description and the specific
651 examples set forth below are given by way of illustration only, since
various changes and
652 modification within the spirit and scope of the "RESP-ROI (Trademark
Registration Number
653 TMA948,326) EXCEL Application", named "RESP-ROI (Trademark Registration
Number
654 TMA948,326) Intelligent Decision Support Platform", as described and
claimed in this
CA 3025302 2018-11-26
22
655 specification, will become obvious to one skilled in the art from a
reading of the following detailed
656 description.
657 With reference to the drawings and, in particular, with reference to
FIG 2, each of the invention's
658 parts are labelled and defined. The title of the invention's dashboard
is RESP-ROI (Trademark
659 Registration Number TMA948,326) Intelligent Decision Support Platform.
A legend in the bottom
660 right hand corner identifies the Bias Computation Dataset, the Sampling
Scheme Dataset and the
661 Hypotheses Tests Dataset presented within the results displays. The
invention's dashboard is subject
662 to copyright protection, Copyright, 2018 Star-Ting Incorporated. All
Rights Reserved Worldwide.
663 The items and their corresponding functionality is listed below in the
sequential balloon numbering
664 system starting at 1 and ending at 105.
ID # Item Functionality
1 Version Information information
2 Business Intelligence Category Select button
3 Competitive Intelligence Category Select button
4 Decision Support Category Select button
Responsible Risk Management Category Select .. button
6 Navigation Control Panel title
7 Knowledge Bank button
8 Return to Main Menu button
9 Help Menu button
User Guide button
11 Source Data button
12 Journal Register button
13 Issue Identification button
14 Classification button
RESP-ROI Scorecard button
16 Series Data Bisect Results title
17 Text Area text box
18 Series Data Bisect Results meter
19 Series Data Bisect Selected Value value
Client Decision Go/No-Go decision (radio button)
21 Utilization Rate title
22 Control Dataset value
23 Control Dataset Usage Rate chart
24 Advanced Operations Panel title
Categorical Operation Selector radio button
26 Nominal Operation Selector radio button
27 Ordinal Operation Selector radio button
28 Interval Operation Selector radio button
CA 3025302 2018-11-26
23
ID # Item
Functionality
29 Ratio Operation Selector radio button
30 Statistical Measures title
31 Categorical - Arithmetic Mean Selector select box
32 Categorical - Geometric Mean Selector select box
33 Categorical - Harmonic Mean Selector select box
34 Categorical - Harmonic Boxplot button
35 Ordinal - Rank Charts button
36 Nominal - Median Selector select box
37 Nominal - Mode Selector select box
38 Interval - Range Selector select box
39 Interval - Skew Selector select box
40 Ratio - Coefficient of Variance Selector select box
41 Ratio - Variance Selector select box
42 Ratio - Standard Deviation Selector select box
43 Ratio - Z-Score Selector select box
44 Ratio - Standard Error Selector select box
45 Sample Scheme Context Dropdown dropdown list
46 Sample Scheme Query text box
47 Analysis Library button
48 Library Dataset button
49 Client Data Exchange hyperlink
50 Risk Scores title
51 Magnitude Risk Score meter
52 Precision Risk Score meter
53 Reliability Risk Score meter
54 Worst Case Risk Score meter
55 Legend - Risk Scores legend
56 Bias Computation title
57 Bias Context Dropdown dropdown list
58 Selected Bias Context Text text box
59 Bias Case 1 benchmark
60 Bias Case 2 benchmark
61 Bias Case 3 benchmark
62 Bias Case 4 benchmark
63 Bias Computation Decision decision
64 Controls info
65 Analyses button
66 Monitoring button
67 What-If button
68 Management button
69 Mitigation button
70 Audit Trail button
71 Validation info
CA 3025302 2018-11-26
24
ID # Item Functionality
72 RESP-ROI Report info
73 Adobe link
74 Hypothesis Tests title
75 HO Query Selector select box
76 H1 Query Selector select box
77 H2 Query Selector select box
78 H3 Query Selector select box
79 H4 Query Selector select box
80 H5 Query Selector select box
81 HO Query Text text box
82 H1 Query Text text box
83 H2 Query Text text box
84 H3 Query Text text box
85 H4 Query Text text box
86 H5 Query Text text box
87 Future Enhancements - Artificial Intelligence button
88 Future Enhancements - Professional Development button
89 Future Enhancements - RESP-ROI Materials button
90 1. Bias Computation 2. Sample Scheme 3. title
Hypotheses Test Results Display
91 Arithmetic Mean chart
92 Geometric Mean chart
93 Harmonic Mean chart
94 Coefficient of Variance chart
95 Median chart
96 Mode chart
97 Standard Deviation chart
98 Variance chart
________ 99 Range chart
100 Skew chart
101 Standard Error chart
102 Z-Score chart
103 Legend - Bias Computational Dataset legend
104 Legend - Sampling Scheme Dataset legend
105 Legend - Hypotheses Tests Dataset legend
665 With reference to the drawings and, in particular, with reference to
FIG 3, the invention's dashboard
666 layout is a collection of elements organized on a page. The common
elements are referenced as A-F.
667 The layout is designed as a high-level overview of the six parts of the
intelligent decision support
668 platform. The six parts are illustrated as A that references the
navigation control panel, B that
669 references the series data bisect/utilization rate, C that references
the advanced operations/statistical
670 measures, D that references the client data exchange/risk scores, E
that references the bias
CA 3025302 2018-11-26
25
671 computations / hypotheses / controls, and F that references the test
results display / future
672 enhancements.
673 With reference to the drawings and, in particular, with reference to
FIG 4, the invention's dashboard
674 is depicted as elements of the navigational control panel consisting of
version information and
675 buttons to take the client to the main menu, help menu and find
resource information in a user
676 guide. Four platforms are accessible by buttons when the client wants
to send or receive information
677 on business intelligence, competitive intelligence, decision support or
Responsible Risk
678 Management (Trademark Registration Number TMA952,719). The invention is
a multi-purpose
679 tool with adaptable functionality where the client has different
options in conducting any qualitative
680 analytics. For example, the client can choose to start a project with
information from the source data
681 button, or the journal register button. The client then proceeds to
issue identification and
682 classification in a sequential process. Alternatively, the client can
click on the RESP-ROI
683 (Trademark Registration Number TMA948,326) scorecard and choose another
starting point more
684 relevant to the investigation. The knowledge bank is a repository for
big data, case studies, lessons
685 learned and regulations and is a source that continually grows as
clients interact with the invention.
686 With reference to the drawings and, in particular, with reference to
FIG 5, the graphical display
687 shows the statistical results from the Series Data Bisect in detail as
well as the display of the
688 statistical results from the Utilization Rate in detail. For example,
as depicted a 100% utilization rate
689 is excellent where full coverage of the source document is available
for the investigation, so the
690 analytics can be applied to the quantified qualitative dataset.
691 With reference to the drawings and, in particular, with reference to
FIG 6, the Advanced Statistical
692 Operations are classified into five categories: categorical, nominal,
ordinal, interval and ratio
693 operations. The Advanced Operations are organized into statistical
measures with the categorical
694 arranged to include charts for: arithmetic mean, geometric mean and the
harmonic mean. The
695 harmonic mean has two separate displays, the first as a clustered
column (bar) chart in the results
696 display and the second as a boxplot and is a unique advantage of the
invention. The ordinal
697 operations are arranged to show rank charts. The nominal operations are
arranged to show median
698 and mode charts. The interval operations are arranged to show range and
skew charts. The ratio
699 operation is used for multiple analytics including hypotheses tests and
comparative analyses, such
700 that the ratio is organized with the following statistical measures:
coefficient of variance, variance,
701 standard deviation, standard error, and Z-score. Each statistical
function follows standard rules of
CA 3025302 2018-11-26
26
702 measurement, descriptive statistics and/or inferential statistics. The
science is already proven, thus,
703 the reliance on the invention's results to return accurate, consistent
and repeatable results is a matter
704 of relying on the fundamental rules of science in the invention's
processing utilizing statistics to
705 generate information for decisions based upon the quantified
qualitative data.
706 With reference to the drawings in FIG 6, shows the results of the
statistical processing of the
707 selected Advanced Operations and associated Statistical Measures that
the invention's statistical
708 processing generated from the quantified qualitative information. The
unique advantage of the
709 invention is the ability to incorporate investigative queries into its
process and return statistical
710 results. An example of a Sample Scheme query, is the claim made by
Environment Canada that its
711 proposed rules would cost about 3.3 billion dollars over 18 years
supported? With the invention a
712 statistically significant result can be generated to make a case or
validate a decision.
713 With reference to the drawings in FIG 6, showing the Advanced
Operations radio buttons that can
714 be selected which are categorical, nominal, ordinal, interval or ratio
choices. The selection of any
715 one radio button will disable any prior selected radio button.
Selecting a radio button will activate
716 the associated Statistical Measures for display within the Results
Display area. The Statistical
717 Measures can be selectively enabled or disabled to focus the analysis
on specific Statistical
718 Measure(s) within the selected Advanced Operations. The interaction
between the Advanced
719 Operations selection with the Statistical Measures selection to update
the Results Display area is a
720 novel embodiment in the invention.
721 Further, the client selection of a Sample Scheme query updates the
Results Display area with the
722 selected query results for the selected Statistical Measures. With
reference to the drawings and, in
723 particular, with reference to FIG 6, showing the Sample Scheme Context
Dropdown, one of the
724 available Sample Scheme Queries can be selected. When a Sample Scheme
Query is selected
725 multiple simultaneous interactions occur. One interaction is the
Selected Sample Scheme Query
726 Context data is updated with the selected Sample Scheme Query data.
Another interaction is both
727 the Advanced Operations and its corresponding Statistical Measures are
enabled and displayed in
728 the Results Display, for example when the Advanced Operations selection
is set to Categorical with
729 the selection of Statistical Measures set to Arithmetic Mean and the
Geometric Mean already
730 enabled, then only the two charts relating to these two measures are
updated in the Results Display
731 area while the remainder of the charts are unchanged. Another example
is when the Advanced
732 Operations selection is set to Ratio with the selection of Statistical
Measures set to Z-Score,
CA 3025302 2018-11-26
27
733 Standard Deviation and Variance enabled, then three charts for these
Statistical Measures are
734 updated within the Results Display area while the remainder of the
charts are unchanged. The
735 Sample Scheme interaction with the displayed results area is a novel
embodiment in the invention.
736 With reference to the drawings in FIG 6, showing the Boxplot button,
this button is only enabled
737 when the Categorical Advanced Operation is selected. The Harmonic Mean
is charted two ways: the
738 first as a bar chart in the Results Display and the second as the
Boxplot accessible via the Boxplot
739 button. The dual plots displaying the statistical results of the
Harmonic Mean is a novel embodiment
740 in the invention.
741 With reference to the drawings and, in particular, with reference to
FIG 7, where one aspect of the
742 invention's dashboard is the uniqueness of the Analyses Library that
lists 212 different analytics
743 available that can be used for quantified qualitative analyses. This
library will be further developed
744 into active templates which will be integrated into the intelligence
decision support platform as a
745 secure, online software system or computer software application or
utility software or software
746 designed to provide a platform to other software for computational
science, game engines, industrial
747 automation and/or service applications. Another aspect of the
invention's dashboard is the structural
748 uniqueness of the Library Dataset that contains 26,200 data items which
is expanding as a fully
749 functional resource. One library dataset is available in English with
other translations to follow. The
750 library dataset has 26,200 data items with future enhancements to grow
and extend the database.
751 The Client Data Exchange is a portal where the client can upload,
exchange and transfer documents.
752 Four risk scores as shown in FIG 7 display statistically significant
results on magnitude, precision,
753 reliability and worst case to help the client make risk-informed
decisions. When a risk score is
754 returned low it indicates risk averse, when a risk score is moderate it
indicates a risk neutral, and
755 when the risk score is high it indicates a risk seeker. Risk scores
provide information that is useful
756 and meaningful to decision makers.
757 With reference to the drawings and, in particular, with reference to
FIG 8, one aspect of the
758 invention's dashboard is the structural uniqueness of the Bias
Computation where the user selects
759 the bias context from a drop-down menu. This selection returns a query
used in the investigation
760 from the different points of view contained in the source document
under investigation. For
761 example, three different positions and/or points of view were
identified in the TP-0001E case, that
762 of the academic study, Canada's Oilpatch and the Federal Government.
Only the RESP-ROI
763 (Trademark Registration Number TMA948,326) Intelligent Decision Support
Platform returned
CA 3025302 2018-11-26
28
764 statistically significant results from a bias computation reflected by
a percentage value that provided
765 a benchmark statistic. For the first-time points of view are
consistently and repeatedly analyzed with
766 percentages from solely the narrative's context. Other analytical
methods are unable to accomplish
767 the transformation of qualitative data into quantified qualitative data
that returns significant
768 statistical results.
769 The level of measurement to determine A Go/No-Go decision is more
accurate when it can be
770 backed with scientific evidence such as the invention provides. For
example, in the TP-0001E case,
771 it was found 59.73% of the press release covered the academic study's
point of view. This
772 information is important when making regulatory decisions based on
academic studies. Knowing
773 how skewed the selection under investigation is, can impact a business
case, judgement or
774 investment.
775 Statistically sound arguments are further supported with evidence, for
example a practical use of the
776 invention, knowing that the academic study reflected one side by as
much as three times more than
777 the other, then the author's point of view is less credible and perhaps
the findings suspect of
778 partiality. The Bias Computation is very meaningful when looking at the
argument considering how
779 much bias was found within, in this example, a press release. Moreover,
the claim by the academic
780 study that "no site would have to pay more than $30 a tonne" and
reducing emissions early could be
781 achieved at a "near zero" was less likely to be credible because the
author's bias was deemed to
782 have 59.73% representation within the press release. Thus, decision
makers would gain important
783 information by knowing how much the press release was skewed to one
side over the other(s) which
784 is one benefit of this novel invention.
785 With reference to the drawings and, in particular, with reference to
FIG 8, showing the Bias
786 Computation dropdown where "Select Bias Context" from the drop-down
menu returns one of the
787 available Bias Queries. When a Bias Query is selected multiple
simultaneous interactions occur.
788 One interaction is the Selected Bias Query Context data is updated with
the selected Bias Query
789 data. Another interaction is both the Advanced Operations and its
corresponding Statistical
790 Measures are enabled and displayed in the Results Display, for example
when the Advanced
791 Operations selection is set to Categorical with the selection of
Statistical Measures set to Arithmetic
792 Mean and the Geometric Mean already enabled, then only the two charts
relating to these two
793 measures are updated in the Results Display area while the remainder of
the charts are unchanged.
794 Another example is when the Advanced Operations selection is set to
Ratio with the selection of
CA 3025302 2018-11-26
29
795 Statistical Measures set to Z-Score, Standard Deviation and Variance
enabled, then three charts for
796 these Statistical Measures are updated within the Results Display area
while the remainder of the
797 charts are unchanged. The Bias Query interaction with the displayed
results area is a novel
798 embodiment in the invention.
799 Flexible navigation is important in analytics because rarely are two
investigations identical. The
800 invention provides a set of buttons for the client to customize the
investigation. The customization
801 with controls, analyses, management, monitoring, mitigation and what-if
provide options for an
802 evergreen product. The likelihood that the invention will become
obsolescent is de-risked by its
803 ability to function as singular elements or multiple processes or as
integrated parts.
804 An audit trail is one aspect of the invention's dashboard that
demonstrates the structural uniqueness
805 of the intelligent decision support platform. The audit trail is a
function to assist the board with its
806 compliance, managers with their activities and risk professionals as a
checklist ensuring that all
807 steps undertaken were documented. The audit trail within the invention
traces the details of the steps
808 of the analytics and/or the steps taken in the risk management. The
audit trail provides a record of
809 the decisions, the changes and the milestones. The audit trail records
important roles and
810 responsibilities of the people involved to ensure compliance and reduce
liability and loss exposure.
811 The database, library, assessments, process steps, or files are tracked
with activities across the
812 invention to protect the organization from internal theft, loss
exposures and ensure documented
813 evidence of the sequence of activities that have or may impact the
specific operation, procedure or
814 event at any time the audit trail is actioned. The audit trail also
reduces down-time for audits and
815 creates less work in organizing documentation as the audit trail
provides records in real-time. The
816 audit trail is beneficial because client's can use the information from
the audit trail for
817 reconciliation, historical reports, future budget planning, tax or
other audit compliance, crime
818 investigation and/or risk management.
819 Validation is important. The invention has a uniquely functional
validation process to check or
820 prove the accuracy of the findings in the investigation. On November
15, 2018, Wikipedia defines
821 "validation is the process of establishing documentary evidence
demonstrating that a procedure,
822 process, or activity carried out in testing and then production
maintains the desired level of
823 compliance at all stages". Similarly, the invention confirms that the
service or product meets the
824 requirements of its clients and returns this validation with
documentary evidence in the final report
825 delivered to the client.
=
CA 3025302 2018-11-26
30
826 The invention has an advantageous embodiment by performing hypotheses
tests in a consistent,
827 repeatable comparative analyses on different queries. Six hypotheses
test are performed with
828 expansions planned in future enhancements. Each query is a stand-alone
investigation but when
829 used in a comparative study adds more meaning because the invention's
statistical processing can
830 return significant statistical results. The client receives valuable
information pertinent to the
831 decision to accept or reject a claim identified in a query. Two or more
opposing hypotheses about a
832 population can be tested. Traditional hypotheses tests only investigate
the null hypothesis and the
833 alternative hypothesis while the invention's novel approach can examine
up to six opposing views.
834 The increased hypotheses examinations are an advantageous embodiment
for the client because it
835 provides additional information to make robust decisions.
836 With reference to the drawings and, in particular, with reference to
FIG 8, showing the Hypotheses
837 Tests checkboxes that can be selected: HO Query, HI Query, H2 Query, H3
Query, H4 Query and
838 H5 Query. The checkboxes are not mutually exclusive when selected,
therefore all or none can be
839 selected. A selection of one hypotheses check box triggers simultaneous
multiple interactions. One
840 interaction is that the Hypothesis Query Data area is populated, for
example, selecting HO Query
841 returns the query text for HO. Another interaction is both the Advanced
Operations and its
842 corresponding Statistical Measures are enabled and displayed in the
Results Display, as when the
843 Advanced Operations selection is set to Categorical with the selection
of Statistical Measures set to
844 Arithmetic Mean and the Geometric Mean already enabled, then only the
two charts relating to
845 these two measures are updated in the Results Display area while the
remainder of the charts are
846 unchanged. Another example is when the Advanced Operations selection is
set to Ratio with the
847 selection of Statistical Measures set to Z-Score, Standard Deviation
and Variance enabled, then
848 three charts for these Statistical Measures are updated within the
Results Display area while the
849 remainder of the charts are unchanged. The Hypothesis Query interaction
with the displayed results
850 area is a novel embodiment in the invention.
851 With reference to the drawings and, in particular, with reference to
FIG 9, is the invention's Test
852 Results Display which is a novel presentation of statistical results
obtained from quantified
853 qualitative data by utilizing arithmetic mean or geometric mean or
harmonic mean or coefficient of
854 variance or median or mode or standard deviation or variance or range
or skew or standard error or
855 Z-score statistical operations. The novel integration of statistical
levels of measurement sets this
856 invention above conventional statistical methodologies. The invention
combines the four levels of
857 measurement commonly used in quantitative analysis which are nominal,
ordinal, interval and ratio
CA 3025302 2018-11-26
31
858 with the conventional qualitative measures only utilizing categorical
analysis. The integration of the
859 quantitative levels of measurement on the quantified qualitative
datasets utilized in the invention is
860 an advantageous embodiment because this invention is the first process
to undertake combining the
861 five statistical levels of measurement to return statistically
significant results on qualitative datasets.
862 The invention's novel Advanced Operations is structured with five
levels of measurement:
863 categorical, nominal, ordinal, interval and ratio which return
increased statistical measures and
864 results in more meaningful statistical coverage than conventional
methodologies.
865 The invention is the first to organize and statistically process
quantified qualitative data, so the
866 narrations or subjective information can be statistically analyzed in
the same manner as quantitative
867 datasets.
868 The categorical level of measurement in the invention measures the
arithmetic mean, geometric
869 mean. Although the invention included the harmonic mean into the
categorical level of
870 measurement, it should be noted that the harmonic mean is not truly
representative of this
871 measurement level. The harmonic mean is representative of fractions,
ratios and in this invention
872 more closely associated with the boxplot as one part of this inventive
new process.
873 The operability of the invention's process to integrate quantified
qualitative data into analytics is
874 seen by statistical results generated when the nominal level of
measurement further classifies the
875 measures of location by utilizing the median and mode on subjective
information. Applying
876 descriptive statistics to qualitative data is new. The invention's
inventive process applies the median
877 when the arithmetic mean may not be representative such as when the
data contains one or two very
878 large or very small values. The median is the midpoint of values after
the quantified qualitative
879 values are ordered from the minimum to the maximum values. The
invention's statistical
880 methodology is framed on descriptive statistics and applies the mode as
the value of the observation
881 that appears most frequently and utilized to summarize the quantified
qualitative data. The
882 disadvantage to the mode is sometimes no value exists or no value
appears more than once and
883 other times there can be multiple modes. In this invention, when the
mode is representative of any
884 symmetric distribution, the mode (similarly the median and mean) are
located at the center and are
885 always equal. For example, in this invention when the distribution is
symmetrical, the median
886 corresponds to the point where the distribution is cut in half.
Similarly, the arithmetic mean is the
887 balance point of a distribution, and when the distribution is
symmetric, the arithmetic mean returns
CA 3025302 2018-11-26
32
888 the same number. Applying this logic to the invention, any of the three
measures would be
889 appropriate to represent the distribution's center.
890 In this invention, the ordinal level of measurement is based on
relative ranking or rating of items;
891 sometimes ranked in order of best to worst, other times ranking is
according to risk ratings while
892 other types of ranking can be scales of relative relationships such as
inferior, poor, good, excellent
893 and superior. The novel aspect in the invention is that the ordinal
level of measurement returns
894 counts and numbers on the quantified qualitative data and can
distinguish the magnitude of the
895 differences between groups.
896 The interval level of measurement in this invention is based on a scale
with a known unit of
897 measurement which is the distance between values. The invention's
interval level of measurement is
898 meaningful and returns statistical units of measurement for range and
for the skew. Unlike
899 traditional statistical analyses where a qualitative variable is
nonnumeric, the quantified qualitative
900 variables are numeric in this invention. A qualitative variable, a
discrete variable and a continuous
901 variable return statistical results in the invention. All three types
of variables can be tested utilizing
902 the interval level of measurement. The novelty of reporting numerics on
qualitative datasets in this
903 invention is highly beneficial to data scientists, executives, managers
and others who desire more
904 comprehensive data coverage and meaningful statistical analyses. The
uniqueness of this invention
905 is to statistically measure with numerics the quantified qualitative
data.
906 The invention follows statistical techniques and levels of measurement
as defined in the 16e
907 Statistical Techniques in Business & Economics reference book by Lind-
Marcha and Wathen.
908 Data recorded in this invention, at the ratio level of measurement are
based on a scale with a known
909 unit of measurement and a meaningful interpretation of zero on the
scale. "Practically all
910 quantitative data are the ratio level of measurement. The ratio level
is the "highest" level of
911 measurement. It has all the characteristics of the interval level, but
in addition, the 0 point is
912 meaningful and the ratio between two numbers is meaningful" (Lind,
D.A., Marchal, W.G., and
913 Wathen, S.A. (2004). Statistical Techniques in Business and Economics,
12e. Meritus University.).
914 Another aspect of the present invention includes a method for
statistically measuring the quantified
915 qualitative dataset the same as the quantitative data utilizing the
ratio level of measurements
916 including coefficient of variance, standard deviation, standard error,
variance and z-score.
CA 3025302 2018-11-26
33
917 The ratio level of measurement is an advantageous embodiment of the
invention because the client
918 can measure more complex estimates such as the maximum social burden of
debt given the current
919 reputation of a corporation and relate the real debt level to this
maximum which is a novel method
920 to analyze quantified qualitative datasets. Another benefit utilizing
the ratio as a statistical
921 measurement in the quantified qualitative dataset is applying financial
indicators such as earned
922 value, flash volume variables, product information, credit scoring,
historical data, transition
923 matrices, historical data, key performance indicators and leading risk
indicators to the quantified
924 qualitative dataset. Expressing absolute metrics in relation to a fixed
measurement scale and
925 subjective information or qualitative activities such as leadership or
the total number of people
926 satisfied with the local governance of a government or activities
related to a new project is
927 statistically significant with the ratio results in this invention.
Time-based metrics where changes in
928 the subjectivity matters over time such as how happy, how comfortable
or how secure a person is
929 with a commodity, investment or product is another advantageous
embodiment in this invention.
930 The invention returns normalized metrics in its transformation and
utilization of the quantified
931 qualitative data. Inputs and outputs are expressed for comparable,
consistent and repeatable
932 statistical results which is another advantageous embodiment in the
invention.
933 Furthermore, the invention's process to utilize quantified qualitative
data on source information
934 establishes a base-line to measure variables at a particular point in
time such as a worker's
935 proficiency in learning new trade skills or the level of motivation one
has.
936 Quantified qualitative datasets are measured similarly to the
quantitative datasets that obtain
937 numerics or numbers such that this advantageous embodiment permits
qualitative data to be
938 counted, numbered and measured unlike the conventional qualitative
statistical processing or
939 methodologies.
940 Structural models can be formed with the statistical results from the
invention's statistical
941 processing of quantified qualitative datasets in various analytics that
generate statistically significant
942 results is another advantageous embodiment.
943 Typical quantitative ratios include financial ratios, macroeconomic
variables and market
944 information such as equity prices, volatility and spreads to which
conventional statistical techniques
945 are unable to apply to the qualitative dataset. In contrast, the
invention's novel method applies
946 statistical, financial, mathematical calculations to quantified
qualitative data and returns impactful,
CA 3025302 2018-11-26
34
947 meaningful and repeatable ratios on qualitative data, such that this
invention is the first to "quantify
948 qualitative" data (Trademark Application Number:1864856).
949 By applying ratios to the quantified qualitative dataset, the invention
also transforms each query or
950 investigation into a comparative study if desired which is another
advantageous embodiment.
951 The invention follows the same procedures for the quantified
qualitative data as conventional
952 science follows statistical techniques on the quantitative dataset. The
invention assists decision
953 makers in the collecting, organizing, presenting, analyzing and
interpretation of data to make more
954 effective decisions. The intelligent decision support platform includes
all relevant statistics. Three
955 independent statistical tests can be performed, and the results are
displayed as bar charts
956 representing the statistical results of the bias computation dataset,
the sample scheme dataset and the
957 hypotheses tests dataset.
958 One aspect of the invention's dashboard is the structural uniqueness of
the Artificial Intelligence
959 button that links to a worksheet as a future enhancement.
960 One aspect of the invention's dashboard is the structural uniqueness of
the Professional
961 Development button that links to a worksheet as a future enhancement.
962 One aspect of the invention's dashboard is the structural uniqueness of
the RESPONSIBLE ROI
963 (Registration Number TMA948,325 File Number 1734079) Materials button
that links to a
964 worksheet as a future enhancement.
965 One aspect of the invention's dashboard is the structural uniqueness of
the display buttons, with
966 reference to the drawings and, in particular, with reference to FIG 10,
the invention's dashboard
967 Navigational Features are shown. Each of the 30 buttons is a quick
reference to additional
968 information to drill down into the specific area to assist the client
with the complicated analytics. A
969 list of thirty different buttons or hyperlinks to various worksheets or
menu items follows:
970 1. Dashboard, detailed in Fig. 1 and Fig. 2.
971 2. Business Intelligence, detailed in Fig. 15.
972 3. Competitive Intelligence, detailed in Fig. 16.
973 4. Decision Support, detailed in Fig. 17.
974 5. Responsible Risk Management (Registration Number TMA952,719 File
Number
975 1752883), detailed in Fig. 18F.
976 6. FE* Knowledge Bank, detailed in Fig. 22.
977 7. Help Menu, detailed in Fig. 2.
978 8. Main Menu, detailed in Fig. 2.
CA 3025302 2018-11-26
35
979 9. Source Data, detailed in Fig. 25.
980 10. Journal Register, detailed in Fig. 18A.
981 11. Issue Identification, detailed in Fig. 188.
982 12. Classification, detailed in Fig. 18C.
983 13. RESP-ROI (Trademark Registration Number TMA948,326) Scorecard,
detailed in Fig. 18.
984 14. Harmonic Boxplot, detailed in Fig. 12.
985 15. Rank Charts, detailed in Fig. 13.
986 16. Controls, detailed in Fig. 18E.
987 17. Analyses, detailed in Fig. 18D.
988 18. Monitoring, detailed in Fig. 181.
989 19. What-If, detailed in Fig. 18G.
990 20. Management, detailed in Fig. 19.
991 21. Mitigation, detailed in Fig. 18H.
992 22. Audit Trail, detailed in Fig. 20.
993 23. FE* Artificial Intelligence, detailed in Fig. 23.
994 24. FE* Professional Development, detailed in Fig. 24.
995 25. FE* RESP-ROI (Trademark Registration Number TMA948,326) Materials,
detailed in Fig.
996 21.
997 26. Validation, Audit Trail, detailed in Fig. 20.
998 27. User Guide, detailed in Fig. 2.
999 28. Analysis Library, detailed in Fig. 14.
1000 29. Library Dataset, detailed in Fig. 2.
1001 30. Client Data Exchange, detailed in Fig. 2.
1002 With reference to the drawings and, in particular, with reference to
FIG 11, the invention's
1003 Quantified Qualitative Analytical Process. The invention starts with
client data that is accepted as
1004 qualitative in a document format such as Word or PDF in the Client Data
Exchange Portal. The
1005 document relates to the service platform chosen by the client, for
example, business intelligence
1006 which might have selected an executive summary or a new project proposal.
The Client Data
1007 Exchange Portal is utilized to exchange and transfer data and / or
other client documents. Either the
1008 document or parts of the accepted document identified as source data
undergoes a transformation
1009 process. The transformation processing is an internal step and
proprietary to Star-Ting Incorporated
1010 or its affiliates that results in quantified qualitative data which is
utilized for the investigations,
1011 queries and / or analytics.
1012 Three control point verifications are used to manage the data entry
into the invention's Intelligent
1013 Decision Support Platform. The Utilization Rate is a decision of
adequate / inadequate content
1014 coverage of the source data. The Series Data Bisect is a decision to
pass / fail because the mid-point
1015 was not correctly selected which could mean the transformation process
was executed incorrectly or
1016 other source data issues are present. The Bias Computations return
levels that could make it difficult
1017 to perform any further analytics such that a Go / No-Go Decision is
made. These unique controls are
CA 3025302 2018-11-26
36
1018 novel in this invention and provide assurance that the client's data
entry can be correctly analyzed
1019 by the Intelligent Decision Support Platform.
1020 A Go Decision assumes that clear client requirements which have been
identified and accepted for
1021 an investigation of the source document by way of one of the seven
platforms in the invention are
1022 met.
1023 After the client authorizes the investigation, the Audit Trail is
initialized and populated with
1024 changes which is an advantageous benefit for auditors or regulators
who require compliance
1025 information or for investors who can make risk-informed decisions. The
Audit Trail initialization
1026 covers seven separate service platforms available in the invention
presently for analytical processing
1027 but with expansions in the service platforms the Audit Trail is
expected to provide additional
1028 coverage. Statistical Processing Audit Trail Updates are an
advantageous embodiment in the
1029 invention.
1030 Two main statistical methods are used in the invention for data
analysis. The first is descriptive
1031 statistics, which summarize data from a sample using indexes such as
the mean (average) or
1032 standard deviation. The second method is inferential statistics, which
draw conclusions from data
1033 and statistical results. The standardization of a measurement scale
using 1-100 was selected because
1034 percentages are more easily determined. The invention's correlation is
an uniquely advantageous
1035 embodiment because unlike conventional mathematical statistics which
failed to correlate
1036 qualitative data, the invention's correlation is a measure of the
relation between two or more of the
1037 qualitative dataset variables. The invention's Statistical Processing
generates numerical values on
1038 the quantified qualitative dataset for statistical results. The
invention's dashboard displays the
1039 statistical results on graphical displays. The Display Results are
shown to capture the various
1040 numerics and meaningful statistics that are generated in the invention
on quantified qualitative data.
1041 At the end of the Advanced Statistical Operations, Preliminary
Validation is performed. Then, an
1042 Extended Analysis can be performed. When the Extended Analysis is chosen
an Audit Trail Update
1043 is performed. After the Audit Trail Updates are complete, a Final
Validation is performed.
1044 The Extended Analysis can be chosen by the client from any of the
seven separate service platforms
1045 which presently include: Business Intelligence, Competitive
Intelligence, Decison Support,
1046 RESPONSIBLE RISK MANAGEMENT (Registration Number TMA952,719 File Number
CA 3025302 2018-11-26
37
1047 1752883), What-If Analysis, Stand-Alone Analysis or any Integrated
Package, other platforms in
1048 the future will also be offered and added.
1049 An intelligence report is written as a deliverable to the client after
the required analytics are
1050 performed in the invention as agreed to in the scope statement of the
contract. At this point the
1051 analytical investigation and specialized qualitative analysis project
is completed, such that the final
1052 invoice can be issued and final payment for the project can be
received.
1053 With reference to the drawings and, in particular, with reference to
FIG 12, showing one depiction
1054 of the Harmonic Boxplot. Typically, the Harmonic Mean applies to speed,
production and cost. The
1055 outputs are important as the Harmonic Mean reflects the average rate
as used in data transmission,
1056 machine productivity or buying stocks. Another way to view the Harmonic
Mean is as an average
1057 rate. The Harmonic Mean is best applied to the boxplot such that the
invention returns outliers on
1058 the quantified qualitative datasets which cannot be done utilizing
traditional analytics.
1059 With reference to the drawings and, in particular, with reference to
FIG 13, showing the Rank
1060 Charts results from several tests returning minimum and maximum values.
The Rank (EQ)
1061 statistical measure was chosen as the measure for one investigative
test in the invention because the
1062 formula gives a rank of 2 to both duplicate scores to tell the order
of a value in that list. The rank is
1063 calculated by arranging the numbers in a specified order (usually
descending), then assigning a
1064 position to each value in the list. Several clustered column (bar)
charts display maximum and
1065 minimum rankings in the invention. Ranking duplicates is an
advantageous embodiment because
1066 ranking duplicates is difficult to differentiate statistically.
1067 With reference to the drawings and, in particular, with reference to
FIG 14, the invention has 212
1068 Analyses templates in its Analyses Library. The Analyses Library
identifies each Catalogue Title
1069 with a reference identification number to track each. The invention's
Analysis templates will each
1070 be built in modules to reduce obsolescence in future enhancements with
increased functionality of
1071 the specialized 212 templates listed below.
No. Ref ID. Catalogue Title
1 200-0001 Abandonment Well Analysis
2 200-0005 ANSOFF Analysis
3 200-0010 Asset Integrity Management Analysis
4 200-0015 Asset Liability Analysis
200-0020 Asset Management Analysis
CA 3025302 2018-11-26
38
No. Ref ID. Catalogue Title
6 200-0025 Automated Production and Asset Operations Risk Analysis
7 200-0030 Barrier Analysis
8 200-0035 Biometric Monitoring Risk Analysis
9 200-0040 Business Change Analysis
200-0045 Business Continuity Analysis
11 200-0050 Business Disruption Analysis
12 200-0055 Business Engagement Analysis
13 200-0060 Business Impact Analysis
14 200-0065 Business Interruption Analysis
200-0070 Business Practices Analysis
16 200-0075 Camp Accommodations Analysis
17 200-0080 Capital Budget Risk Analysis
18 200-0085 Capital Cost Analysis
19 200-0090 Cause-and-effect Analysis
200-0095 Change Impact Analysis
21 200-0100 Change Resistance Analysis
22 200-0105 Changes to Project Objectives Risk Analysis
23 200-0110 Client-Company Analysis
24 200-0115 Climate Change Capping Oil Sands Emissions Analysis
200-0120 Climate Change Carbon Pricing Analysis
26 200-0125 Climate Change Coal and Electricity Analysis
27 200-0130 Climate Change Compliance Analysis
28 200-0135 Climate Change Digital Repositories Risk Analysis
29 200-0140 Climate Change Energy Green Risk Analysis
200-0145 Climate Change Energy Project Risk Analysis
31 200-0150 Climate Change Energy Risk Analysis
32 200-0155 Climate Change Environmental Risk Analysis
33 200-0160 Climate Change Indigenous Risk Analysis
34 200-0165 Climate Change Information Technology Risk Analysis
200-0170 Climate Change International Trade Risk Analysis
36 200-0175 Climate Change Land Risk Analysis
37 200-0180 Climate Change Large Scale Projects Risk Analysis
38 200-0185 Climate Change Litigation Risk Analysis
39 200-0190 Climate Change Mining Risk Analysis
200-0195 Climate Change Procurement Risk Analysis
41 200-0200 Climate Change Public-Private Partnerships Risk Analysis
42 200-0205 Climate Change Reducing Methane Emissions Analysis
43 200-0210 Climate Change Regulatory Risk Analysis
44 200-0215 Climate Change Renewable Energy Development Risk Analysis
200-0220 Climate Change Restrictions and Restoration Risk Analysis
46 200-0225 Climate Change Tax Risk Analysis
47 200-0230 Community Engagement Analysis
48 200-0235 Competitive Market Analysis
CA 3025302 2018-11-26
39
No. Ref ID. Catalogue Title
49 200-0240 Compliance Risk Analysis
50 200-0245 Construction Hazard Risk Analysis
51 200-0250 Contingency Planning Risk Analysis
52 200-0255 Contract Analysis
53 200-0260 Contractor Credit Analysis
54 200-0265 Corporate Governance Analysis
55 200-0270 Corporate Responsibility Analysis
56 200-0275 Corrosion Management Analysis
57 200-0280 Cost Management Analysis
58 200-0285 Cost-Benefit Analysis
59 200-0290 Credit Risk Analysis
60 200-0295 Crisis Management Risk Analysis
61 200-0300 Critical Path Analysis
62 200-0305 Customer Analysis
63 200-0310 Customer Relationship Analysis
64 200-0315 Cycle Time Analysis
65 200-0320 Data Integrity Analysis
66 200-0325 Data Management Analysis
67 200-0330 Decision Tree Analysis
68 200-0335 Delphi Questionnaire Analysis
69 200-0340 Due Diligence Analysis
70 200-0345 Emergency Preparedness Analysis
71 200-0350 Emergency Risk Analysis
72 200-0355 Emissions Trading Analysis
73 200-0360 Engineering Risk Analysis
74 200-0365 Enterprise Risk Analysis
75 200-0370 Environmental Impact Analysis
76 200-0375 Environmental Protection Risk Analysis
77 200-0380 Environmental Risk Analysis
78 200-0385 Equipment Failure Analysis
79 200-0390 Failure Analysis
80 200-0395 Failure Modes and Effects Analysis (FMEA)
81 200-0400 Feasibility Analysis
82 200-0405 Financial Risk Analysis
83 200-0410 Five Whys Analysis
84 200-0415 Fleet Management Risk Analysis
85 200-0420 Front-end Planning Risk Analysis
86 200-0425 Future State Analysis
87 200-0430 GAP Analysis
88 200-0435 Growth Stage Analysis
89 200-0440 Hazard Analysis and Critical Control Points (HACCP)
90 200-0445 Hazard and Operability Study (HAZOP)
91 200-0450 Hazard Identification (HAZID)
CA 3025302 2018-11-26
40
No. Ref ID. Catalogue Title
92 200-0455 Health and Safety Impact Analysis
93 200-0460 Health, Safety, Security and Environment (HSSE) Analysis
94 200-0465 High Level Risk Analysis (HLRA)
95 200-0470 Human Factors Analysis
96 200-0475 Human Failure Analysis
97 200-0480 Incident Management Analysis
98 200-0485 Indirect Cost Analysis
99 200-0490 In-Field Manufacturing Risk Analysis
100 200-0495 Information Technologies Risk Analysis
101 200-0500 Infrastructure Risk Analysis
102 200-0505 Investment Project Analysis
103 200-0510 IT Governance and Security Analysis
104 200-0515 Layer of Protection Analysis (LOPA)
105 200-0520 Leadership Performance Analysis
106 200-0525 Leadership Reliability Risk Analysis
107 200-0530 Lean Supply Chain Analysis
108 200-0535 Life Cycle Analysis
109 200-0540 Maintenance Risk Analysis
110 200-0545 Maintenance System Analysis
111 200-0550 Management Performance Analysis
112 200-0555 Market Risk Analysis
113 200-0560 Merger & Acquisition Analysis
114 200-0565 Methane Emissions Analysis
115 200-0570 Multivariate Analysis
116 200-0575 Myopic Loss Aversion Analysis
117 200-0580 Natural Gas Analysis
118 200-0585 Negotiating Workload Analysis
119 200-0590 Neighborhood Analysis
120 200-0595 Occupied Building Analysis
121 200-0600 Operations Analysis
122 200-0605 Operations and Maintenance Risk Analysis
123 200-0610 Organizational Achievement Analysis
124 200-0615 Organizational Culture Analysis
125 200-0620 Performance Analysis
126 200-0625 PEST-LE Analysis
127 200-0630 Pipeline Analysis
128 200-0635 Pipeline Management Analysis
129 200-0640 Plan of Development (POD) Risk Analysis
130 200-0645 Policy Analysis
131 200-0650 Porter's Five Forces Analysis
132 200-0655 Portfolio Analysis
133 200-0660 Portrait Risk Analysis
134 200-0665 Predictive Maintenance Risk Analysis
CA 3025302 2018-11-26
41
No. Ref ID. Catalogue Title
135 200-0670 Preliminary Hazard Analysis
136 200-0675 Prime Contractor Analysis
137 200-0680 Priority Analysis
138 200-0685 Privacy Impact Analysis (PIA)
139 200-0690 Probability Risk Analysis
140 200-0695 Process Analysis
141 200-0700 Process Hazard Analysis (PHA)
142 200-0705 Process Safety Risk Analysis
143 200-0710 Product Introduction Risk Analysis
144 200-0715 Production Asset Optimization Risk Analysis
145 200-0720 Project Execution Risk Analysis
146 200-0725 Project Impact Analysis
147 200-0730 Project Management Risk Analysis
148 200-0735 Project Plan Analysis
149 200-0740 Project Risk Analysis
150 200-0745 Project Selection Analysis
151 200-0750 Public Opposition Risk Analysis
152 200-0755 Qualitative Risk Analysis (QLA)
153 200-0760 Quantitative Risk Analysis (QRA)
154 200-0765 Regulatory Risk Analysis
155 200-0770 Reliability Based Risk Analysis
156 200-0775 Remote Asset Inspection Risk Analysis
157 200-0780 Remote Asset Monitoring Risk Analysis
158 200-0785 Remote Asset Operations Risk Analysis
159 200-0790 Reputation Risk Analysis
160 200-0795 Resource and Reserves Risk Analysis
161 200-0800 Responsible ROT Analysis
162 200-0805 Risk Appetite Analysis
163 200-0810 Risk Controls Analysis
164 200-0815 Risk Culture Analysis
165 200-0820 Risk Prevention Analysis
166 200-0825 Risk Priorities Analysis
167 200-0830 Risk Tolerance Analysis
168 200-0835 Root Cause Analysis (RCA)
169 200-0840 Safety Culture Analysis
170 200-0845 Safety Risk Analysis
171 200-0850 Scenario Analysis
172 200-0855 Schedule Impacts Risk Analysis
173 200-0860 Scorecard Analysis
174 200-0865 Sensitivity Analysis
175 200-0870 Shared Values Analysis
176 200-0875 Short-Term Onshore Projects Risk Analysis
177 200-0880 Situation Analysis
CA 3025302 2018-11-26
42
No. Ref ID. Catalogue Title
178 200-0885 Six Box Organizational Analysis
179 200-0890 Social License to Operate Risk Analysis
180 200-0895 Solvency Analysis
181 200-0900 Stakeholder Analysis
182 200-0905 Stakeholder Communication Risk Analysis
183 200-0910 Stakeholder Engagement Risk Analysis
184 200-0915 STEEP Analysis
185 200-0920 Stock Communication Analysis
186 200-0925 Strategic Benchmarking Analysis
187 200-0930 Strategy Analysis
188 200-0935 Stress Analysis
189 200-0940 Structural Analysis
190 200-0945 Succession Plan Analysis
191 200-0950 Supplier Performance Analysis
192 200-0955 Survey Analysis
193 200-0960 SWOT Analysis
194 200-0965 Target Analysis
195 200-0970 Task Analysis
196 200-0975 Team Analysis
197 200-0980 Thermal Risk Analysis
198 200-0985 Threat Risk Analysis (TRA)
199 200-0990 Threat to Trade Secret Analysis
200 200-0995 TOWS Analysis
201 200-1000 Toxicity Risk Analysis
202 200-1005 Training Needs Analysis
203 200-1010 Transactional Analysis
204 200-1015 Treasury Analysis
205 200-1020 Turnaround Analysis
206 200-1025 Value of Intellectual Property Analysis
207 200-1030 Values Clarification Analysis
208 200-1035 Vendor Analysis
209 200-1040 Water Quality Risk Analysis
210 200-1045 What-if Analysis
211 200-1050 Wireless Mobility Risk Analysis
212 200-1055 Workforce Analysis
1072 What sets each of the 212 analyses apart in the invention is each
one utilizes quantified qualitative
1073 datasets with statistical processing resulting in numbers for ratios,
percentages and comparative
1074 analyses. Up to now, only quantitative datasets could return this
valuable information to the client.
1075 Multiple benefits exist with the invention's statistical processing of
quantified qualitative datasets in
1076 any assessment, one example is levels of performance in leadership,
qualifications and performance
CA 3025302 2018-11-26
43
1077 can be more accurately examined. Another example impacts action planning
where measuring the
1078 team's ability to act, implement new ideas and interactions with
others can be measured and
1079 compared with other results from other analytics. Queries concerning
change management, response
1080 time, reluctance, satisfaction, motivation, complaints can be measured
and compared statistically.
1081 Another example of a benefit to the client utilizing the invention's
specialized qualitative analysis is
1082 information about cross-functional teams can be statistically measured
and compared, such that
1083 answers to 'would you like to work in a different department'; or 'are
you a good negotiator'; or
1084 'are you able to cooperate with diversified members' take on deeper
meaning. Additionally, the
1085 invention returns significant statistical results on analyzing human
factors such as physical or
1086 mental fatigue, work stress, human error and other subjective
considerations found in shift work.
1087 Another advantageous embodiment of any of the inventions 212 stand-
alone analyses is the
1088 increased knowledge transfer when assimilating new knowledge, sharing
knowledge or expressing
1089 challenges to communications. Furthermore, the invention's unique
method to utilize quantified
1090 qualitative datasets enables questions concerning leadership to be
more meaningful because
1091 statistical results can be compared, for instance leadership support
with team members can be more
1092 precisely analyzed.
1093 With reference to the drawings and, in particular, with reference to
FIG 15, is the invention's
1094 Business Intelligence (BI) Document Selection. Business Intelligence
(BI) represents the domains
1095 that play a key role in the strategic planning of an organization. The
invention provides information
1096 for a client to analyze corporate data that is novel. The invention
provides a unique statistical
1097 process that takes quantified qualitative datasets and returns
significant statistical results, such that
1098 the client gleans information normally missed by other methodologies
to better assist the decision-
1099 making process. Suggested documents are listed for the client to
identify the suitable information to
1100 run analytics on the client's Business Intelligence as seen in FIG 15.
The document intake is
1101 typically a single document with a threshold of 1,500 data counts
(expandable to larger data counts
1102 in future). The benefits to the invention's integration of Business
Intelligence as one platform is
1103 more accurate reporting, analysis or planning because the invention's
statistical process has
1104 improved data quality over other conventional methods. The improved
data coverage contained in
1105 the invention's process of incorporating quantified qualitative data
improves the overall operational
1106 efficiency, customer and employee satisfaction and the client's
competitive advantage.
1107 Modifications to the Business Intelligence Document Selection include
future enhancements that
1108 will build out worksheets and increase functionality of the
Intelligent Decision Support Platform.
CA 3025302 2018-11-26
44
1109 Some modifications will be linked to workflow: source data, journal
register, issue identification
1110 and classification for clarity of illustration.
1111 With reference to the drawings and, in particular, with reference to
FIG 16, similar to Fig 15, is the
1112 invention's Competitive Intelligence Document Selection. Suggested
documents are listed for the
1113 client to identify the suitable information to run analytics on the
client's Competitive Intelligence as
1114 seen in FIG 16. The document intake is typically a single document
with a threshold of 1,500 data
1115 counts (expandable to larger data counts in future). The invention is
the first to integrate
1116 Competitive Intelligence (CI) with Advanced Operations and Statistical
Measures on quantified
1117 qualitative datasets which returns actionable information about
competitors and the marketplace for
1118 the client to form a business strategy. Additionally, with the
invention's capability of risk
1119 management the client can better anticipate and make risk-informed
decisions, for instance
1120 distributing intelligence about products or services, customers,
competitors or any aspect of the
1121 environment needed to support executives and managers in strategic
decision-making for the
1122 organization. Modifications to the Competitive Intelligence Document
Selection will include future
1123 enhancements that will build out worksheets and increase functionality
of the Intelligent Decision
1124 Support Platform. Some modifications will be linked to workflow:
source data, journal register,
1125 monitoring and mitigation for clarity of illustration.
1126 With reference to the drawings and, in particular, with reference to
FIG 17, similar to Fig 15, is the
1127 invention's Decision Support Document Selection. Decision Support is
stronger with the
1128 invention's capability to analyze business data that conventional
analyses miss or cannot analyze.
1129 Quantified qualitative data covers multiple narrations, subjective
information and contains
1130 important information that is difficult to bring into the decision-
making process using conventional
1131 methods. Usually, conventional methods write summary notes in the
financials but are incapable of
1132 applying numerics to the subjective information in a consistent and
repeatable manner; in contrast
1133 the invention analyzes business data more efficiently by returning
significant statistical results.
1134 Suggested documents are listed for the client to identify the suitable
information to run analytics on
1135 the client's internal Decision Support as seen in FIG 17. The document
intake is typically a single
1136 document with a threshold of 1,500 data counts (expandable to larger
data counts in future).
1137 Modifications to the Decision Support Document Selection will include
future enhancements that
1138 will build out worksheets and increase functionality of the
Intelligent Decision Support Platform.
CA 3025302 2018-11-26
45
1139 Some modifications will be linked to workflow: source data, journal
register, issue identification,
1140 classification, analyses and management for clarity of illustration.
1141 With reference to the drawings and, in particular, with reference to
FIG 18, shows the invention's
1142 RESP-ROI (Trademark Registration Number TMA948,326) Scorecard for clarity
of illustration.
1143 The Scorecard provides an overview of an enterprise risk management
system containing the
1144 Journal Register, Issue Identification, Classification, Analyses,
Controls, RESPONSIBLE RISK
1145 MANAGEMENT (Registration Number TMA952,719 File Number 1752883), What-If,
1146 Mitigation, Monitoring and the RESP-ROI (Trademark Registration Number
TMA948,326)
1147 Reports. The Scorecard is a cornerstone in providing standard
comparisons across all risk projects
1148 as well as the ability to provide standard comparisons across all
seven platforms because of the
1149 integration of the statistical processing that populates analytical
results in various dashboard
1150 displays. The invention's Scorecard shows the unique integration of
multiple functions built into the
1151 process as an evergreen system. FIG 18 illustrates a plurality of
process steps associated with the
1152 invention's Scorecard as part of the `RESP-ROI (Trademark Registration
Number TMA948,326)
1153 advanced intelligence system. The system captures narrative and
subjective information; then
1154 analyzes, synthesizes, and scores the quantified qualitative dataset.
The invention's data analytics
1155 generate mathematical and statistical outputs from the statistical
processing and integration of
1156 multiple workflows. The results captured from the invention's
investigative process utilizing
1157 quantified qualitative data are visualized in a graphical display. The
graphics are mostly bar charts.
1158 Several displays show the results of the scored information. For
example: magnitude, precision,
1159 reliability and worst case are displayed on the risk score card.
Afterwards, the scores are reported
1160 and validated as part of the process designed into the `RESP-ROI
(Trademark Registration Number
1161 TMA948,326) Intelligence Decision Support Platform. The steps to
validate are vitally important
1162 because validation helps reduce the estimation of error. The
invention's Scorecard increases data
1163 reliability because science-based knowledge is derived in the
statistical results. The invention's
1164 method is preferred to conventional 'best-guess' or 'consensus' where
uncertainty remains because
1165 instead, the invention's process is repeatable and statistically
correct.
1166 Tracking and refining data using the Scorecard is one way to use the
information while another is to
1167 collect sufficient data points in worksheets. Another is to apply
various metrics providing decision
1168 makers with science-based support for business cases. Another way to
implement the Scorecard is
1169 to use it as a guide to develop practices and develop policy. Each
part of the Scorecard can be used
1170 to supply evidence that an organization has based decisions on
criteria that meets regulatory
CA 3025302 2018-11-26
,
46
1171 standards should the Audit Trail be enabled. The Scorecard is one way
the invention helps board
1172 members, C-Suite and executives make risk-informed decisions to better
allocate resources. The
1173 added level of insight about multiple platforms, projects or analyses
is an advantageous embodiment
1174 of the invention because the client can mine the quantified
qualitative metrics from any of the
1175 Scorecard worksheets within an integrated analyses environment.
Practical uses of the invention
1176 include gaining more information from contextual risks defined as
business practices, culture,
1177 geopolitical, management, market conditions, project location and
public opposition because
1178 qualitative datasets can be analyzed with numerical data. The measured
values for subjective
1179 observations then can be placed in ascending or descending order to
prioritize the risks which is
1180 beyond the capabilities of conventional qualitative analyses in other
systems. Moreover, the
1181 invention utilizes a scorecard to measure achievement or progress
toward attaining multiple goals.
1182 A graphical representation of the progress is tracked by an Audit
Trail which reports on the status,
1183 condition or completion of the analytics. The invention's Scorecard is
a versatile tool which allows
1184 a decision maker to strategize, implement, monitor and mitigate core
controls, exposures and risks.
1185 The metrics within the scorecard are used in management to identify
and improve internal functions
1186 of the business, feedback mechanism and discuss perspectives from
business units, departments or
1187 projects. Having a centralized repository for the various workflows
via the Scorecard is an
1188 advantageous embodiment because organized processes eliminate
redundancies and increase
1189 productivity. Several future enhancements will include associated
worksheets for increased
1190 functionality of the linkage to workflow(s).
1191 With reference to the drawings and, in particular, with reference to
FIG 18A, the invention's Journal
1192 Register details the records, responsibilities and includes
information pertinent to the analysis or the
1193 investigation, such as the date raised, owner, assigned to, user roles
and focus area. In the invention
1194 many focus areas exist showing the flexibility of the invention's
utility. Some of the focus areas
1195 depicted in FIG 18A are construction, director's and officer's
liability, energy, insurance,
1196 manufacturing or safety process risk. Conventional analytics focus on
one area of specialization, but
1197 this invention is different because decision-making crosses all focus
areas and the quantified
1198 qualitative statistical process can be applied similarly to all; thus,
increasing efficiencies and
1199 reducing client costs.
1200 With reference to the drawings and, in particular, with reference to
FIG 18B, the invention's Issue
1201 Identification which provides the issue description. Examples of
entries to identify risk in the
1202 invention are: business interruption services, contingency planning,
safety integrity, protocol or
CA 3025302 2018-11-26
47
1203 environmental issues such as ground conditions, surface preparation or
water management. One
1204 benefit resulting from the invention's Issue Identification is that
stringent environmental constraints
1205 can be identified with respect to workers and work safety. Handling
harmful substances, plant
1206 machinery, big equipment, complex scheduling and constraint management or
even confined work
1207 spaces such as detailed in Fig. 18B are auditable with the invention's
Audit Trail feature.
1208 The Reason or Cause column is a useful entry. Some examples of ways the
invention can be used by
1209 the client is when considering reasons for delays in approval, causes
that resulted in insufficient
1210 information or reasons for design issues or determining factors that
led to social disturbances.
1211 One advantageous embodiment of the invention is to statistically
measure performance indicators
1212 such that queries into honesty, dependability and accountability
return results about precision and
1213 magnitude which conventional analytics are unable to return.
1214 Risk Tolerance is anther column entry in the Issue Identification
worksheet that enables the client to
1215 better understand the corporate threshold and limits. The invention
has Risk Score as referenced in
1216 Fig. 2 (50-55) results that better enable the client to identify its
risk tolerance.
1217 Key Performance Indicators (KPIs) are entered in the invention's Issue
Identification worksheet to
1218 identify internal and external sources of risk. A Key Performance
Indicator is a quantifiable measure
1219 used to evaluate the success of an organization, employee or a
specific objective for performance
1220 such as reliability. In conventional methods capturing KPIs to
ascertain how a company is doing or
1221 ways to track the company's business progress has only been with the
quantified dataset. With the
1222 invention's quantified qualitative dataset, the subjective information
can also be measured for the
1223 first time. Tracking what is important to the organization is more
robust with this invention's novel
1224 process because business metrics are analyzed with subjective factors.
Examples of the subjective
1225 factors the invention measures are: people, relationships, management
and performance. The
1226 subjective factors are measured as quantified qualitative datasets.
Each qualitative factor is
1227 important. Almost always subjective information pertains to the
success of an organization such that
1228 by measuring the subjective information the client has a broader
picture of its key objectives, values
1229 or targets. The client gains more information to make a well-informed
decision.
1230 The Risk Triggers column are often associated with Key Risk Indicators
(KRIs). Triggers are
1231 indicators that a risk has occurred or about to occur. KRIs deal with
leading factors used to
1232 determine strategies for risk mitigation or risk response strategies.
Process safety risk is one type of
CA 3025302 2018-11-26
48
1233 risk analyses that the Risk Triggers column's entries help management
define and measure for risk
1234 activities. Exposing losses and vulnerabilities from failed internal
process, people, policy or
1235 procedures before they happen is one way the Risk Trigger column is used.
Each metric from the
1236 invention's quantified qualitative process has the potential to change
the client's risk profile.
1237 Potential Risk is a column in the invention's Issue Identification
worksheet to identify errors or
1238 potential weaknesses, gaps or compliance issues to name a few. The
impact value and probability
1239 value are measured, and totals are calculated in the invention's
future enhancements so that the
1240 Inherent Risk Index can be automatically calculated. The Inherent Risk
Index is the assessment
1241 score of risks not taking current controls into consideration
(Assurance values). The Inherent Risk
1242 Index's equation is: Impact x Probability, such that on the
invention's risk scale "High" is 92-95%
1243 probability that Critical to Harmful impact on cost, schedule, or
technical would result. The
1244 information gathered from the invention is substantial for decision
makers because it means action
1245 is required to alleviate the issue as described, for clarity of
illustration.
1246 With reference to the drawings and, in particular, with reference to
FIG 18C, the invention's
1247 Classification includes a Failure Modes and Effects Analysis that
analyzes functional requirements
1248 which will be automated in future enhancements. Calculated risk is a
hazard or chance of failure
1249 whose degree of probability is estimated before some undertaking is
performed. One risk
1250 calculation used to determine the severity and likelihood of project
success, is the equation: Severity
1251 x Likelihood. Another formula for risk, is where risk equals impact
multiplied by probability
1252 weighed against the costs: Risk = Impact x Probability / Cost. Impact
is the effect on the
1253 organization should a risk event occur. Probability is the likelihood
the event could occur within a
1254 given timeframe. An advantageous embodiment is the invention's risk
scale where the nomenclature
1255 is more precise and the rating of the scale 1-100 is the same as
percentages, for instance, "High
1256 Certainty" is 97-98% probability that a "Detrimental" impact on cost,
schedule, or technical would
1257 result. The percentage of risk impact gathered from the invention is
important information for
1258 decision makers because it means action may or may not be required to
alleviate the issue.
1259 Another advantageous embodiment in the invention is integrating risk
assessments from different
1260 perspectives; thus, the invention is more robust and offers stronger
risk evaluation of potential
1261 danger or exposure. An inventive step is its integration of multiple
frameworks. For example,
1262 Enterprise Risk Management (ERM) is integrated with APEGA's ALARP (as low
as reasonably
1263 practicable) and with Failure Mode and Effects Analysis (FMEA).
Integrating best practices from
CA 3025302 2018-11-26
49
1264 multiple frameworks sets the invention above others because of the
robust analytics applied to
1265 create new solutions. The invention incorporates Enterprise Risk
Management's process of
1266 planning, organization, leading and controlling risk activities to
minimize risk effects with the
1267 specialized risk functions from APEGA's ALARP to better control major
hazards. Additionally, the
1268 invention combines best practices used in safety process risk. Another
inventive step is the
1269 utilization of Failure Mode and Effects Analysis (FMEA) which is a
step-by-step process to identify
1270 potential failures in design, manufacturing, assembly or design
failures in engineering by assigning
1271 a Risk Priority Number (RPN) as stand-alone or as an integrated risk
package; thus, supporting the
1272 client with multiple ways to customize.
1273 Traditionally practitioners choose qualitative analyses like hazard
studies, specifically HAZID
1274 (Hazard Identification) as the first formal study to identify
potential hazards and threats. Often
1275 HAZIDs are carried out by questionnaires, focus groups or by relying
on experts. Each of the
1276 conventional methodologies systematically introduces error as personal
opinions or consensus
1277 incorporating personal bias is relied on. In contrast, the invention
relies on source documentation,
1278 which is analyzed and statistically processed for statistically
significant results. The invention's
1279 methodology is superior.
1280 The invention's Classification includes a novel way to prioritize risk
that is only available when the
1281 client chooses to select four platforms as an integrated package,
which are: the business intelligence,
1282 competitive intelligence, decision support and RESPONSIBLE RISK
MANAGEMENT
1283 (Registration Number TMA952,719 File Number 1752883). Using the risk
scores from several
1284 platforms increases the reliability of the overall risk score which is
beyond traditional risk analytics.
1285 The Invention's Triangulation formula is new and takes the results
from three different scores of
1286 risks across different perspectives and on the same scale returns Risk
Scores where the decision
1287 maker can look at four different parameters including: magnitude,
precision, reliability and worst
1288 case, as referenced in Fig. 2 (50-55).
1289 Triangulation Equation: (Impact x Probability) + (Severity X
Likelihood) / 2 = n.
1290 The result is calculated and displayed in the Issue
Prioritization Heat Map, where the
1291 severity is plotted on the x-axis and likelihood is plotted on
the y-axis.
1292 Then, a comparable analysis between the results of the Issue
Prioritization Heat Map and that of
1293 selected Risk Scores including factors like Magnitude, Precision,
Reliability, Worst case is
1294 undertaken which provides important information. At this point the
analysis can be completed or
CA 3025302 2018-11-26
50
1295 extended into inferential statistical analyses. Results from the
triangulation equation integrated into
1296 the risk scores is meaningful, for instance, a score of 99% could be
an inevitable and catastrophic
1297 impact on cost, schedule, or technical function that could prevent the
successful completion of a
1298 project. Action would be extremely necessary and required to mitigate
the issue. Additionally, the
1299 Audit Trail could provide insights as to compliance or root cause, so
the invention's multiple
1300 utilities of measuring risk across several platforms in any
association, corporation, entity or
1301 organization is beneficial as described for clarity of illustration.
1302 With reference to the drawings and, in particular, with reference to
FIG 18D, the invention's
1303 Analyses specialization is in qualitative analyses unlike conventional
methods that are limited to a
1304 categorical level of measurement. The invention's statistical
processing extends into the four levels
1305 of measurement reserved for quantitative analytics, such that the
invention's method is more
1306 consistent and repeatable as well as more robust. Another way the
invention's analyses are different
1307 than conventional data analytics is the unique integration of the
probability of occurrence from
1308 multiple perspectives as previously described in Fig. 18C. The
invention's Analyses column titled
1309 Impact Intensity for clarity of illustration shows one way the client
gains relevant information about
1310 the Work Breakdown Structure (WBS) to simplify the project execution
or response strategy.
1311 Industrial applicability of the invention is extensive, for example
getting approval, identification
1312 number, license or other authorization required by Environmental Law
such as an Environmental
1313 Permit. The Impact Intensity is very important for corporations who
require control permits and
1314 waste management licences or discharge authorizations. Enabling the
client to better understand the
1315 conditions, barriers and essential requirements impacting trade
effluent consents and agreements is a
1316 benefit. The number of annual incidents, cost per incident, total
annual cost is calculated and
1317 recorded with the invention's Audit Trail.
1318 The formula used to calculate the Total Annual Cost is,
1319 Number of Annual Incidents * Cost Per Incident = Total Annual Cost.
1320 The invention's Analyses measures the probability of occurrence,
weighted cost as well to increase
1321 the current effectiveness of controls over the risk event, where 100 =
ad hoc and is equivalent to
1322 ineffective and 1 = extremely effective. The Assurance column
calculations will have increased
1323 functionality as the Intelligent Decision Support Platform increases
its functionality and automation.
1324 The increased functionality will allow the invention's Analyses to
calculate the Value at Risk (VaR)
CA 3025302 2018-11-26
51
1325 as another statistical measure which is used to assess the level of
risk associated with a portfolio or
1326 company.
1327 Analyses are supported by means of sample scheme drill-down and
hypotheses tests which return
1328 numeric values in the invention's dashboard's graphic displays.
Further analyses for business
1329 intelligence, competitive intelligence, decision support or RESPONSIBLE
RISK
1330 MANAGEMENT (Registration Number TMA952,719 File Number 1752883) is
determined by the
1331 activation of the invention's dashboard buttons. Extended analyses
into features of the scorecard are
1332 available when the user selects worksheets by activating navigational
features, buttons or
1333 hyperlinks.
1334 Presently, the invention can provide a Residual Risk Index assessment
score to check the level of
1335 effectiveness of controls over a risk event. The ranges considered are
1-1000. The equation is
1336 Probability x Impact x Assurance. When the Residual Risk Index is
considered in relation to the
1337 Triangulation Equation referenced in FIG 18C, the client gains a very
robust analysis which helps
1338 mitigate risk events throughout the organization.
1339 Another special feature built into the invention is the Risk Matrix
which is a qualitative depiction of
1340 the expected Value at Risk (VaR). Traditional scales of measurement
usually reflect high as
1341 substantial impact and low as a minimal impact. The invention's
Analyses returns more precise
1342 results by utilizing a novel scale based on 1-100 which reflects a
percentage value, the scale is
1343 clearly defined as referenced in FIG 18K.
1344 With reference to the drawings and, in particular, with reference to
FIG 18E, the invention's
1345 Controls which provide information to the client about several
important areas to consider that
1346 could potentially reduce risk exposures or assist with the choices a
client has available to avoid,
1347 transfer, mitigate or accept the associated risk(s). For clarity of
illustration, one column in the
1348 Controls worksheet shows Existing Strategies which provide information
to enable a client to
1349 comply with regulatory aspects. Another example of industrial
applicability of the invention is
1350 applying the specialized process of qualitative analytics to queries
such as whether to establish SOX
1351 / C-SOX or other regulatory compliance 30-days before the required
date to ensure compliance.
1352 Another column in the Controls worksheet shows Risk Efficacy which
provides tips and techniques
1353 to better manage the current or existing risk within the organization.
Internal procedures and
1354 policies are key focus areas to gain information that uncovers gaps,
so the Risk Efficacy column is
1355 an important and beneficial feature that is part of the Intelligent
Decision Support Platform. The
CA 3025302 2018-11-26
52
1356 invention's column for Best Practices is flexible and a multi-use
column where information is
1357 entered for present or future knowledge. Human factors and attributes
from best practices, case
1358 studies, lessons learned are more meaningful utilizing the invention's
methodology because
1359 comparative analyses can be performed that conventional analyses
cannot do. Best practices in the
1360 invention include: case studies, lessons learned and insurance trend
data which is continually
1361 expanding. The simulated risk mitigation strategies and risk scenarios
often are created while
1362 considering best practices, thus, the wealth of information the
invention collects is an advantageous
1363 embodiment.
1364 Integrated as part of the invention is a Decision Tree Analysis that
enables the client to glean more
1365 information pertaining to choices using a binary approach such as, yes
or no, this or that. As
1366 strategies and recommendations become more complex the Decision Tree
Analysis's configuration
1367 is extended to SWOT analyses, STEEP and PEST-LE (Stand-Alone platforms)
so the client can
1368 select the type of investigation which better supports the client's
risk appetite: avoid, transfer,
1369 mitigate or accept the risks. The invention's flexibility to provide
customization for the client as a
1370 fit-for-purpose solution is an advantageous embodiment.
1371 With reference to the drawings and, in particular, with reference to
FIG 18F, the invention's
1372 RESPONSIBLE RISK MANAGEMENT (Registration Number TMA952,719 File Number
1373 1752883), is the first to integrate business, contextual, hazard,
operational, strategic and safety
1374 process risk on minor and major projects into one platform using
quantified qualitative data in its
1375 analytical processing. RESPONSIBLE RISK MANAGEMENT (Registration Number
1376 TMA952,719 File Number 1752883), is the first to triangulate risk
across business intelligence,
1377 competitive intelligence and decision support to prioritize the
overall risk to an entity. The result is
1378 displayed in the Issue Prioritization Heat Map as referenced in Fig.
18C.
1379 Conventional risk methodologies require different approaches for the
variations of risk types, such
1380 as a different approach for operational (project) risk than for
strategic (enterprise) risk than for
1381 contextual (global) risk such that analyzing and treating risk is a
lengthy and time-consuming
1382 process that is very costly. The disadvantage of enterprise risk
management or data-driven decision-
1383 making is its limitation to put number values on any of the
qualitative assessments such that
1384 important subjective information is underutilized.
1385 "Data-driven decision-making and its attendant models and
algorithms can produce poor,
1386 unacceptable or even disastrous results" (Heires, April 2017,
p.40).
CA 3025302 2018-11-26
53
1387 "Many mistakes can occur when pursuing data-driven decision-
making" (Heires, April
1388 2017, p.40).
1389 "These include an inability to change the mindset of the business
to value data over gut
1390 instinct and domain experts, a lack of a clearly identifiable
business goals and clear-cut
1391 questions to guide the data driven effort, and not being able to
tie data analysis outputs to
1392 actual business outcomes that can then be financially measured"
(Heires, April 2017, p.41).
1393 "A 11 DDDM efforts are dependent on the quality and limitations of
the data used" ...
1394 "DDDM models are also vulnerable to poor design, ... such as
overfitting, spurious
1395 correlations and the identification of inappropriate criteria"
(Heires, April 2017, p.41).
1396 Heires, K. (April, 2017). Flaws in the Data. Risk Management. The
Risk and Insurance
1397 Management Society, Inc. RIMS. New York.
1398 In contrast to conventional limitations, the invention's capability to
utilize quantified qualitative
1399 data in any risk assessment is more robust. For clarity of
illustration as an example, built into the
1400 invention are leading indicators that capture early warnings of
potential problems. A practical use of
1401 the invention is that the operability of the client's system in a safe
and reliable functioning condition
1402 is better handled with the invention because cost, schedule and
performance factors are analyzed
1403 with quantified qualitative datasets that extend beyond the
limitations of conventional
1404 methodologies. The advantageous embodiment of increasing data coverage
on operability
1405 performance enables process improvements to be captured that might
have been missed or
1406 overlooked without the consideration of the qualitative data.
1407 RESPONSIBLE RISK MANAGEMENT (Registration Number TMA952,719 File Number
1408 1752883) is the integration of operational (project) risk, strategic
(enterprise) risk and contextual
1409 (global) risk. Operational (project) risk covers factors like resource
availability, labour productivity,
1410 timeliness, site and logistics. Strategic (enterprise) risk covers
factors like changes to execution
1411 strategy or project objectives, exposure to business risks,
organization alignment and joint venture
1412 issues. Contextual (global) risk covers factors like project location,
business practices, market
1413 conditions, geopolitics, public opposition and trade regulations
(export/import). A benefit to the
1414 invention's integration of multiple types of risk under one platform
saves the client time and money
1415 by reducing redundancies and duplication of several assessments
throughout the organization being
1416 streamlined into the Intelligent Decision Support Platform. The
invention operates on many
CA 3025302 2018-11-26
54
1417 platforms as easily as one. Streamlining many assessments into one
platform as this present
1418 invention does, increases the operational efficiencies and capability
to monitor all projects within a
1419 single solution. Many benefits exist from improved time and cost
efficiency to the client being able
1420 to identify and trouble-shoot issues earlier. The invention's
integration of multiple analytics will
1421 also help control, reduce and mitigate better the impact of risk
events.
1422 Another aspect of the present invention includes a worksheet as
illustrated in FIG 18F that entries
1423 for Governance, Key Risk Indicators, Critical Success Factors, High
Targets can be identified. The
1424 structural uniqueness of the RESPONSIBLE RISK MANAGEMENT (Registration
Number
1425 TMA952,719 File Number 1752883) workflow is the integration of Key Risk
Indicators as
1426 numerics because the invention's capability of returning statistically
significant results on the
1427 quantified variables found in lessons learned, best practices or case
studies. High Targets is a novel
1428 way to express harmful, detrimental or catastrophic elements. The
invention is unique by taking the
1429 High Targets and using the results for multiple purposes, one such
purpose is to better identify
1430 process improvements. A risk management plan in the invention defines
the history and Value of
1431 Risk Assessment with respect to the analytics effectiveness. The risk
management plan benefits
1432 multiple stakeholders in the organization from governance to project
engineers as each can use the
1433 information to measure performance and efficiency gains.
1434 The invention uses quantitative metrics in risk financing in the same
way conventional
1435 methodologies incorporate the Net Present Value (NPV) or the Value at
Risk (VaR) which is
1436 beneficial for managers when determining capital budget planning and
proposals. A future
1437 enhancement of the invention will be the inclusion of line items on
the balance sheet, income
1438 statement and cash flow statement for the quantified qualitative
dataset results which can now be
1439 done with the quantitative datasets.
1440 Risk Allocations is part of the invention's unique structure that
allocating the cost of capital, hazard
1441 risk and loss exposures will have increased functionality in future
enhancements. Similarly,
1442 RESPONSIBLE ROI (Registration Number TMA948,325 File Number 1734079) will
be extended
1443 to include beyond basic risk measures specialty calculations for risk
management formulas, total
1444 cost of risk in future enhancements, refer to FIG 21 for more detail.
1445 With reference to the drawings and, in particular, with reference to
FIG 18G, one aspect of the
1446 Intelligent Decision Support Platform is the structural uniqueness of
the What-if selection which is
1447 where scenarios and simulations can be conducted.
CA 3025302 2018-11-26
55
1448 The invention is novel because the Harmonic Boxplot's functions are
uniquely applied to What-If
1449 scenarios. The Harmonic Boxplot reveals outliers that when combined
with High Targets is a novel
1450 brainstorming technique built into the invention. The High Targets result
from RESPONSIBLE
1451 RISK MANAGEMENT (Registration Number TMA952,719 File Number 1752883). The
1452 brainstorming is an advantageous embodiment because new opportunities
are explored, potential
1453 threats discovered and contingency planning stronger. With this
increased functionality, the
1454 invention offers a wider range of techniques to determine how
projected performance is affected by
1455 changes. Conventional What-Ifs determine the effect of the outcomes in
a statistical model in
1456 conjunction with a risk assessment, while the invention extends the
modelling because it brings in
1457 the harmonic boxplot as a novel technique to read outliers which can
impact the organization's risk
1458 priority or other risk metrics. What-ifs are defined as sensitivity
analysis and often used as a
1459 brainstorming technique in conventional models; however, the
invention's integration of quantified
1460 qualitative datasets with the What-Ifs provide a broader range of
known variables, such that the end
1461 result of identifying gaps and narrowing assumptions, reducing
systemic error and gaining extra
1462 knowledge from the invention's statistical processing is an
advantageous embodiment.
1463 Traditionally, the What-If Analysis is carried out from the Data tab
in Excel, selecting Goal Seek
1464 and entering fields such as what goal is required to pass an exam. The
information is quantitative
1465 but under traditional analysis the qualitative data is limited with no
numerics. In contrast, the
1466 invention can apply numerics to the qualitative data and return
statistical results using the
1467 conventional methodology.
1468 The invention has a structural uniqueness that is disruptive and far
more advantageous to clients.
1469 The invention extracts What-Ifs from the source data to determine
priorities, risk scores and now
1470 contingency planning. The information extracted by the invention in
the statistical processing is
1471 invaluable because outliers show up in the Harmonic Boxplot. The
outliers extracted from the
1472 Harmonic Boxplot comprise the value situated farthest from the main
point of focus within the
1473 investigation such that it becomes a leading risk indicator for
examination of gaps, missed
1474 opportunities or unusual activity. Additionally, the outliers are
associated with lowest and highest
1475 risk to the association; therefore, the client has a better starting
point to create scenarios and
1476 simulations based on relevant information that other analytics miss.
1477 The invention's What-If has many uses, one example is that a
systematic review of the design and
1478 operation of a system (brainstorming technique). Another example of
the invention's capability to
1479 provide creative What-If scenarios is seen by process engineering
where the engineer assesses the
CA 3025302 2018-11-26
56
1480 current situation and traditionally uses a market survey, or a
questionnaire to identify the needs of
1481 potential clients. The invention quantifies the qualitative data
supplied in the market survey or
1482 questionnaire and returns statistically significant results, which in
turn enable the process engineer
1483 to identify the needs of the client with more precision. Similarly, in
the design of the process
1484 conceptualization the determination of compositions, connections or
optimization of apparatus have
1485 a human component that traditionally is not assessed, now with the
invention the human factors
1486 bring in additional meaning, such that the process engineer can make
stronger decisions about the
1487 execution of the project.
1488 Traditional analyses do not validate published reports or draft
versions, for instance, in
1489 instrumentation when the project implementation stage drafts
documentation. In contrast, the
1490 invention can analyze the draft or published report to provide
significant statistical results.
1491 Conventional analytics cannot put numbers on human factors such as when
mechanical engineering
1492 requires checking on building and assembly work where human failure
can be a strong determinant
1493 and result in project failure. In contrast, the invention can analyze
human factors associated with the
1494 building and assembly work and potentially mitigate the project
execution risk.
1495 The invention is capable of monitoring, acquisition and evaluation of
operating data in the
1496 qualitative dataset unlike conventional methods which return
mechanical engineering numbers on
1497 widgets; instead, the invention returns numerics on concepts,
judgments and opinions.
1498 What-Ifs are useful in health, safety and environment to better focus
on health, safety or
1499 environmental improvements. The invention can better assist a client
with troubleshooting by
1500 providing more information across the organization with robust
metrics. The invention's metrics are
3.501 fed into the What-If scenarios to enable clients to conduct research,
development, feedback,
1502 modeling, simulation, 3D and 4D computational modeling and assist the
client with constant
1503 product innovation as new opportunities are identified within the
invention's multiple analytics.
1504 What-Ifs better help decision makers better understand their internal
controls and the assumptions
1505 underpinning managerial decisions for example a practical use of the
invention is if a financial
1506 statement shows a balance of $1,000 worth of Fixed Assets, it implies
that the management asserts
1507 that fixed assets exist. Traditionally, no further analytics can be
applied for meaning. However, the
1508 invention can drill down into a quantified qualitative analysis which
results in further meaning. The
1509 client can answer questions concerning the assertion, how much bias
was in the statement and
CA 3025302 2018-11-26
57
1510 whether the claim of a balance of $1,000 Fixed Assets is reliable;
therefore, the invention's
1511 statistical processing is disruptive and far-reaching as many uses
exist where management make
1512 assertions and claims with a way to measure those assertions.
1513 In the invention, another application of the What-Ifs to better help
decision makers better
1514 understand the external constraints such as social license to operate.
Stakeholder communication
1515 can be evaluated, analyzed and an intelligence report providing
additional meaning or perspectives
1516 to the underlying issue along with potential solutions and
recommendations as part of the
1517 invention's reporting process. All these examples are written for
clarity of illustration of the
1518 invention's What-If functionality.
1519 With reference to the drawings and, in particular, with reference to
FIG 18H, the invention's
1520 Mitigation worksheet columns include: Mitigation Strategies, Risk
Response Strategy, Responsible
1521 Role / Job Title, Annual Control Cost as well as Cost/Benefit for
clarity of illustration. Each column
1522 increases the client's ability to mitigate risk and maximize profits
across the enterprise, within
1523 varying business units or in separate departments. Queries such as
'are standards achieved by the
1524 risk team satisfactory' are statistically significant as percentages
are standardized on the invention's
1525 scale where insignificant severity and a rare likelihood of an event
represents 1%. Decision makers
1526 can read the statistical results and apply better decisions from the
information gleaned from the
1527 invention. Clicking on the Mitigation button using the dashboard's
navigation controls opens a
1528 worksheet to identify a risk response strategy and the responsible
person assigned to each task.
1529 Utilizing the unique cross-functionality designed in the invention's
worksheets enables the decision
1530 makers to be risk-informed. Choices for next steps are clearer because
science-based evidence is
1531 gained with the information from the invention which in turn increases
the reliability of the
1532 mitigation plan.
1533 With reference to the drawings and, in particular, with reference to
FIG 181, the invention's
1534 Monitoring for clarity of illustration; procedures are a large part of
monitoring, but often human
1535 error interferes with the successful implementation of procedures such
that knowledge gained from
1536 the invention's unique capability to return significant statistical
results on questions relating to
1537 procedures is important. For instance, 'do you follow procedures
exactly to the rule' or 'does your
1538 team follow procedures reluctantly' or 'do you know when to enforce
safety rules' can be analyzed,
1539 measured and compared to better enable decision makers to monitor
processes and procedures in the
1540 organization.
CA 3025302 2018-11-26
58
1541 Monitoring the progress on actions is a feature contained within the
scorecard that helps record
1542 updates, status intervals and comments. The invention enables the
client to better monitor the
1543 associated risks with an organized layout and plan for Monitoring
where the invention specifically
1544 provides columns in the worksheet for Updates, Status Interval,
Monitoring concerns, Comments,
1545 Contingent Action and Review Comments. The progress on actionable items
is a future
1546 enhancement that with increased functionality of the invention will
increase efficiencies.
1547 With reference to the drawings and, in particular, with reference to
FIG 18J, the invention's RESP-
1548 ROI (Trademark Registration Number TMA948,326) Reports for clarity of
illustration; one aspect
1549 of the Intelligent Decision Support Platform is the structural
uniqueness of the RESP-ROI
1550 (Registration Number TMA948,326 File Number 1752882) Report that
provides statistical
1551 measures on quantified qualitative data from repeatable test results.
Meaningful statistical measures
1552 are reported on the findings from the areas of the investigation
performed in the invention and
1553 extracted into the report. The report is uploaded to the Client Data
Exchange Portal as a pdf file and
1554 is available to the end-user/client by way of the Client Data Exchange
Portal.
1555 The delivery of an intelligent report that provides a summary of the
decision(s) is an essential part
1556 of integrating all business processes into an automated workflow. This
functionality is ideal in
1557 today's digitized marketplace and with increased functionality will
assist C-Suite and management
1558 alike in managing multiple portfolios.
1559 In the invention which is an Intelligent Decision Support Platform,
the structural uniqueness is
1560 disclosed with process steps for the integration of quantified
qualitative data into business
1561 intelligence, competitive intelligence, decision support and / or
RESPONSIBLE RISK
1562 MANAGEMENT (Registration Number TMA952,719 File Number 1752883) utilizing
a
1563 dashboard with numerical results and graphic displays. Using a library
dataset of 26,200 data items,
1564 each process starts with source data that contains quantified
qualitative values. A Go / No-Go point
1565 is reached with a decision to proceed with the investigation into what
meaning the quantified
1566 qualitative data adds, changes, nullifies or validates in the decision-
making process. The advanced
1567 operations and statistical measures return significant statistical
information from the quantified
1568 qualitative data which is used for issue identification,
classification, analyses, management,
1569 monitoring and mitigation. Bias Computation delivers the percentage of
author's bias within the
1570 data. The Sample Scheme drills down with advanced statistical measures
on queries concerning
1571 points of interest to generate results displayed in the graphic
results displays. The Sample Scheme
CA 3025302 2018-11-26
59
1572 initiates the start of the formal investigation to find statistical
meaning behind the narrative.
1573 Hypotheses Tests provide comparative queries and results. The final
step is to generate a report
1574 detailing the findings and the results in an intelligence report which
is delivered to the client. For
1575 example, a practical use of the invention is utilizing the invention's
Advanced Operations and
1576 Statistical Measures on an analysis of a press release resulted in an
intelligence report published on
1577 November 8, 2018, "Methane Reductions Intelligence Report" of the TP-
0001E Methane Emissions
1578 Case Study. This report authored by Loreen Sherman and Wayne Olson has
the ISBN 978-0-
1579 9916942-1-1 and is incorporated by reference into the specification of
this application.
1580 For clarity of illustration, with reference to the drawings and, in
particular, with reference to FIG
1581 18K, the invention's Scales are shown representing the scale values as
found on the Issue
1582 Identification and the Classification worksheets. The scale value from
1-100 was selected because
1583 in mathematics, a percentage is a number or ratio that represents a
fraction of 100. Calculating
1584 percent increase or decrease is easier by using a scale already in
percentages. For example, a
1585 practical use of the invention is to calculate the percentage
increase, work out the difference
1586 (increase) between the two numbers being compared. Then divide the
increase by the original
1587 number and multiply the answer by 100. When the answer is negative, it
denotes a percentage
1588 decrease. This formula is well-known in mathematics and in statistics;
therefore, utilizing the
1589 percent scale for risk has multiple advantages. First, no conversions
are required. Second,
1590 percentages are more easily compared than fractions. Third, financial
institutions quote interest
1591 charges to the client on loans or interest paid for money invested as
a percentage. Plus, one of the
1592 most frequent ways to represent statistics is by percentage.
Therefore, for common functionalities,
1593 ease of use and utility, the invention's scale was selected to be
represented as a percentage.
1594 Novel to the invention, is the nomenclature chosen as a standard set
matching the percentages on the
1595 invention's Scale, thus, the invention's analyses returns more precise
results by utilizing a novel
1596 scale based on 1-100 which reflects a percentage value as follows:
Severity Value Likelihood Value
Insignificant 1 Rare 1
Insignificant 2 Rare 2
Insignificant 3 Rare 3
Insignificant 4 Rare 4
Noticed 5 Unlikely 5
CA 3025302 2018-11-26
60
Severity Value Likelihood Value
Noticed 6 Unlikely 6
Noticed 7 Unlikely 7
Noticed 8 Unlikely 8
Noticed 9 Unlikely 9
Detected 10 Low 10
Detected 11 Low 11
Detected 12 Low 12
Detected 13 Low 13
Detected 14 Low 14
Uncovered 15 Low 15
Uncovered 16 Low 16
Marginal 17 Low 17
Marginal 18 Low 18
Marginal 19 Low 19
Tolerable 20 Low-Medium 20
Tolerable 21 Low-Medium 21
Tolerable 22 Low-Medium 22
Tolerable 23 Low-Medium 23
Tolerable 24 Low-Medium 24
Observable 25 Low-Medium 25
Observable 26 Low-Medium 26
Observable 27 Low-Medium 27
Observable 28 Low-Medium 28
Observable 29 Low-Medium 29
Identified 30 Low-Medium 30
Identified 31 Low-Medium 31
Identified 32 Low-Medium 32
Identified 33 Low-Medium 33
Identified 34 Low-Medium 34
Pinpointed 35 Low-Medium 35
Pinpointed 36 Low-Medium 36
Pinpointed 37 Low-Medium 37
Pinpointed 38 Low-Medium 38
Pinpointed 39 Low-Medium 39
Mild 40 Probable 40
Mild 41 Probable 41
Mild 42 Probable 42
Mild 43 Probable 43
CA 3025302 2018-11-26
61
Severity Value Likelihood Value
Mild 44 Probable 44
Recognizable 45 Probable 45
Recognizable 46 Probable 46
Recognizable 47 Probable 47
Recognizable 48 Probable 48
Recognizable 49 Probable 49
Moderate 50 Medium 50
Moderate 51 Medium 51
Moderate 52 Medium 52
Moderate 53 Medium 53
Moderate 54 Medium 54
Noticeable 55 Medium 55
Noticeable 56 Medium 56
Noticeable 57 Medium 57
Noticeable 58 Medium 58
Noticeable 59 Medium 59
Manifested 60 Plausible 60
Manifested 61 Plausible 61
Manifested 62 Plausible 62
Manifested 63 Plausible 63
Manifested 64 Plausible 64
Exposed 65 Plausible 65
Exposed 66 Plausible 66
Exposed 67 Plausible 67
Exposed 68 Medium-High 68
Exposed 69 Medium-High 69
Adverse 70 Medium-High 70
Adverse 71 Medium-High 71
Adverse 72 Medium-High 72
Adverse 73 Medium-High 73
Adverse 74 Medium-High 74
Adverse 75 Medium-High 75
Impactful 76 Likely 76
Impactful 77 Likely 77
Impactful 78 Likely 78
Impactful 79 Likely 79
Significant 80 Likely 80
Significant 81 Likely 81
CA 3025302 2018-11-26
62
Severity Value Likelihood Value
Significant 82 Likely 82
Significant 83 Likely 83
Significant 84 Likely 84
Significant 85 Likely 85
Major 86 Very Likely 86
Major 87 Very Likely 87
Major 88 Very Likely 88
Unprotected 89 Very Likely 89
Unprotected 90 Very Likely 90
Unprotected 91 Very Likely 91
Critical 92 High 92
Critical 93 High 93
Harmful 94 High 94
Harmful 95 High 95
Harmful 96 High 96
Detrimental 97 High Certainty 97
Detrimental 98 High Certainty 98
Catastrophic 99 Inevitable 99
Catastrophic 100 Inevitable 100
1597 Two distinct advantages exist with the invention's novel scale. The
first, is the scale is easy to apply
1598 percentages because it has scored values from 1-100. The second
advantage is the language used to
1599 identify the levels between ranges is more specific than the general
terms of "high" and "low", such
1600 that the scale identifies risk severity and likelihood with more
precise terms and ranges.
1601 With reference to the drawings and, in particular, with reference to
FIG 19, the invention's
1602 Management for clarity of illustration; silos exist as part of
management but are often seen as a
1603 bottleneck or as a roadblock. The invention's capability to analyze
silos, work environments,
1604 strategic decision making and whether someone wants to work alone or be a
team player is a benefit
1605 to organizations because the invention's results can enable project
execution strategies, changes to
1606 project objectives or a deeper understanding of organizational issues.
Additionally, the invention
1607 helps managers make risk-informed decisions concerning JV approvals,
capabilities, fatigue,
1608 expertise, schedule impacts or stress in the organization.
1609 The Management worksheet in the invention helps organize critical
information pertaining to
1610 Business, Leadership and Governance which are described in each column
showing the multitude of
CA 3025302 2018-11-26
63
1611 variations that this invention's analytics apply. Future enhancements
are workflows tied to
1612 professional development, assessments, compensation, scenarios,
simulations, What-Ifs, industry
1613 process standards, national standards and international standards. The
Management workflow sheet
1614 will also be linked to the Knowledge Base so critical information can
be assessed.
1615 With reference to the drawings and, in particular, with reference to
FIG 20, the invention's Audit
1616 Trail where the focus on validation is an extremely important function
of compliance for clarity of
1617 illustration. The invention's Audit Trail has the potential to help
with business interruption studies,
1618 management of change and change readiness in addition to its preferred
embodiment of tracking the
1619 process and client steps in the Intelligent Decision Support Platform.
1620 Project Controls are an essential part within any system for
successful implementation of a project.
1621 The lack of focus on correct metrics can be detrimental. Quality
issues at all levels can cause a
1622 project to fail. The invention has an Audit Trail that enables
decision makers to better understand
1623 the project execution and performance metrics with respect to the
overall statistical processing and
1624 scorecard. Benchmarks help ensure correct metrics are used in the
invention. Owners, Engineering,
1625 Procurement and Construction (EPC), Contractor or Suppliers of any
team gain support with an
1626 Audit Trail that tracks design changes or changes to specifications in
the invention as they occur.
1627 The Audit Trail interrelates all the invention's analyties and
processes for statistical processing into
1628 a detailed report that documents the history of the investigation.
1629 One aspect of the dashboard is the structural uniqueness of the Audit
Trail and Time Validation
1630 Mechanism to ensure that the numbers or methodology is not overwritten
or changed without proper
1631 clearance. Future enhancements to the Audit Trail include increased
functionality of the application
1632 into a cloud-based software technology.
1633 With reference to the drawings and, in particular, with reference to
FIG 21, the invention's
1634 RESPONSIBLE ROI (Registration Number TMA948,325 File Number 1734079) for
clarity of
1635 illustration; the materials in this section will be extended beyond
basic risk measures to advanced
1636 specialty calculations with additional risk management formulas such
as total cost of risk in future
1637 enhancements. The cycle of information is evergreen with the
enhancements built modularly. The
1638 expansion of material will be integrated as part of a system that
works together. One way that
1639 RESPONSIBLE ROI (Registration Number TMA948,325 File Number 1734079)
already connects
1640 in the invention is a value-add to RESPONSIBLE RISK MANAGEMENT
(Registration Number
1641 TMA952,719 File Number 1752883) previously described in FIG 18F.
CA 3025302 2018-11-26
64
1642 With reference to the drawings and, in particular, with reference to
FIG 22, Knowledge Bank for
1643 clarity of illustration; the invention's Knowledge Bank interrelates
with the Scorecard and each of
1644 the seven platforms available for a specialized qualitative
assessment. The Knowledge Bank
1645 provides a repository for a growing library of big data, case studies,
lessons learned and regulations
1646 necessary for various analytics. Live feeds and streaming real time
data are functionalities planned
1647 for future enhancements.
1648 With reference to the drawings and, in particular, with reference to
FIG 23, Artificial Intelligence,
1649 for clarity of illustration; the invention has the capability to
statistically analyze the productivity
1650 level of humans, creativity and human innovation factors; however,
future enhancements will
1651 further develop the quality, speed and time elements as well as risk
communication into the process.
1652 Artificial Intelligence as a cognitive function potentially could be
further improved by exploring,
1653 analyzing and comparing the quantified qualitative datasets through
time. At present, the invention
1654 is the only database with quantified qualitative datasets such that
this advantageous embodiment as
1655 it exists is potentially disruptive as cognitive knowledge.
1656 Presently, the invention's decision analytics process is the first in
the world that involves
1657 statistically processing quantified qualitative inputs, applying
Advanced Operations and Statistical
1658 Measures resulting in data outputs with numerics like the quantitative
datasets. Extended analytical
1659 evaluation is part of the Intelligent Decision Support Platform with
at least seven different platforms
1660 available to the client. In the future, strong linkage to Artificial
Intelligence (Al) exists in cognitive
1661 enhancement with data outputs. Additional development and testing is
required to develop this
1662 potential. Derivative products and services will result from the
additional development and testing.
1663 Licensing options are planned.
1664 With reference to the drawings and, in particular, with reference to
FIG 24, Professional
1665 Development for clarity of illustration; the invention will provide
support to clients and users with
1666 respect to application training and the statistical measures utilized
and their use for clients because
1667 the statistical processing utilized is novel, unique and unfamiliar to
academics, associations,
1668 government, industry and professionals. The formal support via
conferences, seminars, workshops
1669 or in the invention's user guide and manuals will enlighten others to
the unique structure and
1670 quantified qualitative process that drives the underlying intelligence
and analytics. The intensive
1671 and collaborative training will have many forms and future
enhancements will include training
1672 manuals, modular courses in addition to client support.
CA 3025302 2018-11-26
65
1673 Another advantageous embodiment is the invention's analytics results
identify is gaps in process
1674 continuity where training others or labour turnover or the
competitiveness of the organization's
1675 culture are more precisely assessed.
1676 With reference to the drawings and, in particular, with reference to
FIG 25, Client Source
1677 Documentation for clarity of illustration; the invention's source
document is uploaded to the Client
1678 Data Exchange Portal as an intake. Document management including document
ownership are
1679 easily determined with the invention's multi-level user permissions
either to access some or partial
1680 data, for example separate storage for client information and another
for the service provider.
1681 The client verifies the source document is correctly entered by a
visual inspection. The main
1682 responsibility is to ensure that the source document covers the scope
of the investigation as
1683 specified in the terms of the contract. Not all documents can
appropriately represent specifications;
1684 thus, training professionals on how to select appropriate documents is
essential to apply correct
1685 analytics for statistical processing in the invention. After the
client visually inspects the source
1686 document, additional information is required such as the mid-point of
the source document. The
1687 invention's Series Data Bisect is the first in the world that enables
the client to identify the mid-
1688 point to ensure data integrity as a control point that the quantified
qualitative data was correctly
1689 integrated into the Intelligent Decision Support Platform's analytics.
The client accepts or rejects
1690 the source document as entered. The balances-and-checks built into the
Intelligent Decision Support
1691 Platform increase the confidence in the system and its generated
results.
1692 "Alternative embodiments of the invention," is the strong linkage to
Artificial Intelligence (Al) as
1693 implementation of the software-based online system provides more data
storage and increased
1694 datasets to perform cognitive tasks in decision-making.
1695 "Alternative embodiments" is cognitive enhancements with an extended
Knowledge Bank that
1696 provides information streaming in real time data, big data, case
studies, lessons learned, regulations
1697 and live feeds.
1698 "Alternative embodiments" is the development of specialty financial,
social and risk calculations to
1699 provide deeper risk measures and triangulate a risk score utilizing
inherent risk index, prioritization
1700 scores and the residual risk index that will provide an overall entity
correlation of the basic risk
1701 measures: exposure, volatility, likelihood, consequences, time horizon
and correlation.
CA 3025302 2018-11-26
66
1702 "Alternative embodiments" is the development of training materials for
professional development.
1703 Informational materials, courseware, guides and manuals which will be
developed with in
1704 specialized and focused courses. Client support is one example that a
user guide will be provided to
1705 assist leadership, teams and governance.
1706 "Alternative embodiments" is the invention's ability to integrate
separate platforms into the process
1707 with information collected pertaining to risk management.
1708 "Alternative embodiments" is the invention's ability to provide better
GAP Analyses. Conventional
1709 Gap Analyses could not quantify statistically subjective information;
therefore, important qualitative
1710 factors were either missed, set aside or derived an answer with
increasing systemic error. The
1711 problem was that no available tools were capable of compiling and
integrating both the qualitative
1712 and quantitative data into statistical measures and / or numerics.
Moreover, no available tool could
1713 provide a bias computation. No available tool could combine the
qualitative data with a numeric
1714 statistic for a risk rating to report on how these qualitative
variables influence decision-making over
1715 time. No available tool could provide an integrated intelligence tool
with an audit trail to help
1716 balance risk across internal, external and decision support functions
for an overall risk score. The
1717 underdeveloped dataset is essential to provide information from data
queries to support decision
1718 makers but was not available. All phases of a company's business
development from initiation to
1719 maturity are adversely impacted with only half of the available
information being utilized because
1720 the qualitative inputs were not being measured numerically. This means
that no consistent
1721 comparisons of the qualitative information resulted until the
invention provided these missing
1722 elements through its first in the world's process to integrate
quantified qualitative data into
1723 analytics.
CA 3025302 2018-11-26